Can the U.S. stock market continue to deliver its historical return? In the preliminary draft of his paper entitled “A Pragmatist’s Guide to Long-run Equity Returns, Market Valuation, and the CAPE”, John Golob poses two questions:
- What long-run real return should investors expect from U.S. equities?
- Do popular metrics reliably indicate when the U.S. equity market is overvalued?
He notes that the body of relevant research presents no consensus on the answers to these questions, which both relate to long-term growth in corporate earnings per share. Recent forecasts for real stock market returns range from as low as 2% to about 6% (close to the 6.5% average since 1871), reflecting disagreements about how slow GDP growth, low dividends, share buybacks and the profitability of retained earnings affect earnings per share growth. The author introduces Federal Reserve Flow of Funds (U.S. Financial Accounts) and S&P 500 aggregate book value to gauge effects of stock buybacks. He also assesses the logic of using Shiller’s cyclically adjusted price-earnings ratio (CAPE or P/E10) as a stock market valuation metric. Using S&P 500 Index price and dividend data, related earnings data and U.S. financial and economic data as available during 1871 through 2013, he concludes that:
- Changes in the S&P 500 market capitalization divisor and U.S. Financial Accounts data indicate that share buybacks increase in recent decades, allowing per share earnings to grow faster than GDP.
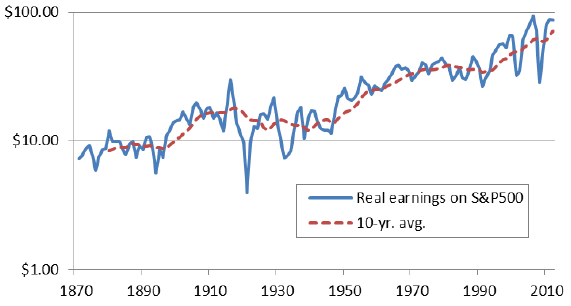
- From the third quarter of 2004 through the third quarter of 2013, the S&P 500 market capitalization divisor falls by an average 0.5% per year, implying that per share earnings rises 0.5% per year faster than earnings (shown in the chart below).
- U.S. Financial Accounts data indicate that average annual net share issuance is +0.75% before 1984 but -0.5% since.
- Despite large fluctuations, neither U.S. Financial Accounts data nor the S&P 500 earnings-to-book value ratio support a view that increased retention of earnings (substitution of stock buybacks for dividends) depresses long-term profitability.
- Moreover, the S&P 500 earnings-to-book value ratio exceeds its earnings yield, implying that lowering the payout ratio (dividend yield) boosts long-run returns. Specifically, during 1976 through 2013, the average return-on-book value for the S&P 500 is 13%, nearly double its 6.7% average earnings yield.
- Regarding P/E10 as a stock market valuation tool:
- P/E10 is sensitive to the composition of returns (dividends versus capital gains, the latter driven by earnings growth). As the mix shifts away from dividends and toward capital gains boosted by retained earnings, equilibrium P/E10 rises.
- If the equity premium remains stable as the risk-free rate declines to historically low levels (as currently), equilibrium P/E10 should rise above its historical average.
The following chart, taken from the paper, tracks real S&P 500 earnings and its 10-year average since 1871. The author offers evidence that, even with relatively weak future GDP growth, the stock market can deliver its historical return because publicly held companies can “turbocharge” earnings per share by (1) buying back stock and (2) sustaining high profitability on associated retained earnings.
In summary, some evidence supports a case that the U.S. stock market will continue to generate returns in line with its long-run average even with GDP historically weak.
Cautions regarding conclusions include:
- As noted in the paper, earnings growth and stock market returns vary widely for extended periods (for example, the average annual real return on the S&P 500 Index is about 15% during the 1990s and -3% during the 2000s). These large, extended fluctuations make sample periods very short for reliable inference.
- The paper does not address the prospect that there may be limits on demand for corporate products and services, such that profitability and earnings per share eventually deteriorates.