Do emerging markets still deserve their reputation as a portfolio-diversifying asset class? In the October 2013 version of their paper entitled “Emerging Equity Markets in a Globalizing World”, Geert Bekaert and Campbell Harvey examine whether, given the dramatic globalization of the past 20 years, it still make sense to classify country equity markets as “developed” or “emerging.” Using monthly returns as available for developed and emerging equity markets mostly during January 1988 through August 2013, they conclude that:
- As of 2012, emerging markets comprise over 30% of world GDP but only 12.6% of equity market capitalization. In contrast, the U.S. comprises 25% of world GDP and 45% of world equity market capitalization. A simple portfolio strategy that each year allocates funds to developed and emerging equity indexes based on prior-year market capitalization (GDP) generates a gross average annual return of 7.4% (8.3%). Volatility is slightly higher for the GDP-weighted allocation, but the Sharpe ratio is also higher.
- During January 1988 through August 2013, the gross compound return in excess of U.S. Treasury bills for emerging (developed) markets is 8.0% (3.7%), with annual standard deviation 23.8% (15.3%) and gross annualized Sharpe ratio 0.33 (0.24).
- From the mid-1990s to mid-2013, the five-year rolling correlation of monthly returns between emerging and developed markets increases from roughly 0.40 to about 0.90.
- Five-year rolling beta for emerging markets relative to a world index varies between 1.2 to 1.6 since the late 1990s. Emerging markets outperform (perform similarly to) developed markets when developed market returns are positive (negative).
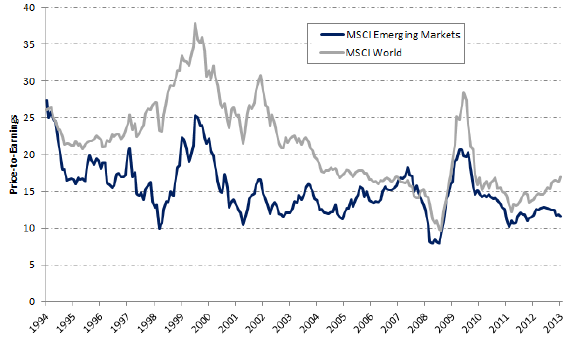
- During the mid-1990s through the mid-2000s, emerging markets traded at much lower price-earnings ratios (P/E) than developed markets, but P/E’s have since converged (see the chart below). However, P/E reflects industry mix and varies widely from one emerging market to the next.
- Among developed markets, industry and country factors explain country differences about equally. Among emerging markets, country factors have twice the power of industry factors to explain country differences.
- Correlations between equity market returns in local currency and changes in the dollar value of the local currency for 22 emerging markets are (unlike for developed markets) generally positive, thereby reducing the diversification power of the emerging markets.
The following chart, taken from the paper, compares P/E for emerging and developed (MSCI World) equity markets. Results suggest that P/Es are converging and emerging markets are becoming more like developed markets. However, P/Es vary widely across emerging markets depending on industry mix.
In summary, with emphasis on the mismatch between emerging country shares of world GDP and equity market capitalization, evidence suggests that emerging equity markets still offer useful (but diminishing) diversification of developed equity markets.
Cautions regarding conclusions include:
- The sample period is short for reliable assessment of long-term trends in correlation and valuation relative to number of business cycles, bull-bear markets and events that might disrupt globalization.
- Reported returns are gross, based on indexes. Costs of creating, maintaining and rebalancing tradable funds would reduce these returns. These costs may differ between developed and emerging markets, thereby reducing the gap between them.