Is there a better way than the Fed model to measure relative attractiveness of equities and bonds. In his October 2020 paper entitled “Towards a Better Fed Model”, Raymond Micaletti examines seven Fed Model alternatives, each comparing a 10-year forward annualized estimate of equity returns to the yield of 10-year constant maturity U.S. Treasury notes (T-note). The seven estimates of future equity returns are based on autocorrelation-corrected quarterly regressions using 10 years of past quarterly data for one of: (1) Aggregate Investor Allocation to Equities (AIAE); (2) Cyclically-Adjusted Price-to-Earnings Ratio (CAPE); (3) Tobin’s Q (QRATIO); (4) Market Capitalization-to-Nominal GDP (MC/GDP); (5) Market Capitalization-to-Adjusted Gross Value Added (MC/AGVANF); (6) Market Capitalization-to-Household and Non-Profit Total Assets (MC/HHNPTA); and, (7) Household and Non-Profit Equity Allocation-to-Nominal GDP (HHNPEQ/GDP). He calculates AIAE as total market value of equities divided by the sum of total market value of equities and total par value of bonds, approximated by adding the liabilities of five categories of borrowers. He then tests for each alternative a tactical asset allocation (TAA) strategy that each month weights equities and bonds based on a modified z-score of the forecasted 10-year equity risk premium (equity return minus T-note yield) computed by subtracting the median and dividing by the standard deviation of actual monthly premiums over the past 10 years. If modified z-score is greater than 1 (less than -1), the strategy is 100% in equities (0% in equities). In between those thresholds, weights are based on linear interpolation. Using quarterly data from the Archival Federal Reserve Economic Database (ALFRED) and Robert Shiller’s data library and daily U.S. equity market returns and U.S. Treasury bond/note roll-adjusted futures returns as available from the end of the fourth quarter of 1951 through the end of the third quarter of 2020, he finds that:
- Compared to the other six sources of earnings estimates, AIAE has the lowest average and lowest total absolute differences between return forecasts and actual forward returns. Moreover, AIAE forecasts become more accurate over time, while those most other indicators become less accurate. It appears that asset supply-demand dynamics are more important than economic measures of value.
- AIAE-based equity return forecasts generally work better in the TAA strategy described above than the other six forecasts during August 1977 through September 2020 (for which required equity and bond returns are available).
- Across various subperiods (generally coinciding with major equity market tops and bottoms), AIAE TAA consistently ranks in the top three strategies.
- AIAE TAA has the highest average gross Sharpe ratio across subperiods across strategies with similar average equity exposures.
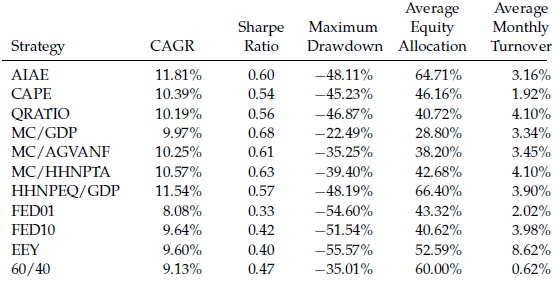
- AIAE TAA also beats a conventional 60/40 equities/bonds strategy and the original Fed model (see the table below).
The following table, taken from the paper, compares performances from August 1977 through September 2020 of the seven alternative TAA strategies outlined above plus four other strategies as follows:
- FED01 – Fed model using trailing 12-month earnings to compute earnings yield.
- FED10 – Fed model using inflation-adjusted average earnings over the past 10 years to compute earnings yield.
- EEY – a regression-based Excess Earnings Yield model using 10 years of past data.
- 60/40 – conventional 60/40 equities/bonds allocation, rebalanced quarterly.
Results show that AIAE TAA has the highest compound annual growth rate (CAGR), among the highest annualized gross Sharpe ratios and nearly the highest average equity allocation. However, it has a deep maximum drawdown.
In summary, evidence indicates that alternatives to the original Fed model that use more sophisticated equity return forecasts outperform the Fed model.
Cautions regarding findings include:
- Sample and test periods are very short in terms of number of independent 10-year forecast intervals. Moreover, using a 10-year lookback interval to predict a 10-year return likely involves much noise.
- As noted in the paper, most of the economic and earnings data incorporates revisions that impound some lookahead bias. However, this bias may not be material.
- Reported performance data are gross, not net. Accounting for stock and bond fund costs and fees would reduce all returns.
- As noted, the best-performing alternatives to the original Fed model still have deep maximum drawdowns.
- Testing multiple potential predictors on the same noisy data incorporates data snooping bias, such that results for the best-performing predictor overstate expectations. The use of a 10-year lookback interval for regressions may also impound snooping bias, and the individual predictors selected for comparison may also have been snooped from larger sets of alternatives.
- The overall methodology is beyond the reach of many investors, who would bear fees for delegating to an investment advisor or fund.
See also “Simple Asset Class ETF Value Strategy (SACEVS)” and results of this search.