Is price-to-earnings ratio cyclically adjusted via a 10-year average (CAPE, or P/E10) a good predictor of future stock market performance? In his October 2012 paper entitled “The Enhanced Risk Premium Factor Model & Expected Returns”, Javier Estrada examines three simple models that generate 10-year annualized stock market expected return (ER) based on P/E10 and the risk-free rate (Rf). Specifically, the three models hypothesize that ER is:
- The product of a linear function of P/E10 and Rf: ER = (a + b * P/E10) * Rf
- The sum of independent linear functions of P/E10 and Rf: ER = c + d * P/E10 + e * Rf
- A simple linear function of P/E10: ER = f + g * P/E10
…where parameters a, b, c, d, e, f and g derive from monthly regressions over a rolling historical window of 120 months. He assesses the performance of the models by comparing forecasted and actual future 10-year annualized stock market returns. He uses the S&P 500 as a proxy for the stock market. Using monthly S&P 500 earnings and 10-year Treasury note yields (as the risk-free rate) for December 1949 through December 2001 and monthly S&P 500 Index total returns from December 1959 through December 2011, he finds that:
- Model 1 effectively predicts stock market performance, with a correlation of 0.88 between forecasted and actual future 10-year annualized total returns and an average monthly forecast error of -1.42% (the model forecast is on average somewhat too high).
- Since the beginning of 1986, the correlation between forecasted and actual future 10-year annualized total returns is 0.95, with average monthly forecast error -0.48% (the model forecast is a little too high).
- P/E10 is modestly better at forecasting stock market returns than either price-to-earnings ratio or dividend-to-price ratio based on one year of lagged data.
- Replacing the current risk‐free rate with a 3-year, 5-five year or 10-year moving average of the risk-free rate does not substantially improve the forecast.
- Model 2 slightly outperforms Model 1, with a correlation of 0.95 between forecasted and actual future 10-year annualized total returns and an average monthly forecast error of 0.07%
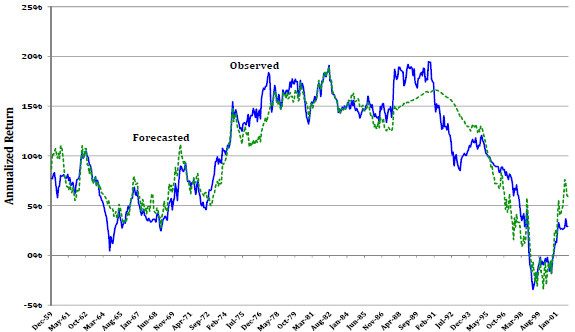
- Though simpler, Model 3 performs about as well as Model 2, with a correlation of 0.94 between forecasted and actual future 10-year annualized total returns and an average monthly forecast error of 0.04% (see the chart below). In other words, the risk-free rate appears to be unimportant in predicting stock market returns.
The following chart, taken from the paper, compares forecasted and actual 10‐year annualized S&P 500 Index total returns based on monthly calculations over the sample period for the simplest of the three models (Model 3), with forecasted returns a linear function of P/E10. Forecasts track actuals closely (correlation 0.94) and are well-calibrated (average monthly error 0.04%).

in summary, evidence indicates that P/E10 is a good predictor of 10-year annualized stock market returns for the U.S. over the past five decades.
Cautions regarding findings include:
- A 10-year annualized return forecast, which ignores intra-decade volatility, does not support tactical trading. For a different perspective, see “P/E10 and Future Stock Market Returns”.
- The sample period is short in terms of independent 10-year measurement intervals for P/E10 and 10-year annualized returns (only about five intervals). The very large overlap in measurement intervals for monthly calculations may substantially inflate conventional correlations, thereby undermining hypothesis testing via conventional statistical significance tests.
- Use of indexes, which do not account for the costs of creating and maintaining tradable assets (trading frictions and management fees) may overstate achievable returns.
- Testing multiple models on the same set of data introduces data snooping bias, such that the best model incorporates some luck.
See also See “Predictive Power of P/E10 Worldwide” and “Testing P/E10 in Developed Markets”.