Is global diversification within asset classes disappearing as worldwide economic and financial integration increases? In their August 2016 paper entitled “Globalization and Asset Returns”, Geert Bekaert, Campbell Harvey, Andrea Kiguel and Xiaozheng Wang examine whether economic and financial integration increases global comovement of country equity, bond and currency exchange market returns. They examine three measures of return comovement for each asset class: average pairwise correlation, average beta relative to the world market and average idiosyncratic volatility. They apply these measures separately to developed markets and emerging markets. Using monthly equity, bond and currency exchange market returns in U.S. dollars for 26 developed markets and 32 emerging markets as available from various inceptions through December 2014, they find that:
- Measures of economic integration based on both laws/regulations/treaties and investment holdings mostly increase over the sample period, but the 2008-2009 financial crisis halted or even reversed integration for some countries.
- Most measures indicate greater global comovements in second halves of available asset class return samples than in first halves. Specifically:
- For equity markets:
- Average return correlation across developed (emerging) markets increases from 0.56 to 0.79 (0.31 to 0.62).
- Average beta relative to the world market across developed (emerging) markets increases from 0.97 to 1.18 (0.90 to 1.19).
- Average idiosyncratic volatility across developed (emerging) markets decreases from 0.21 to 0.15 (0.40 to 0.21).
- For bond markets:
- Average correlation across developed (emerging) markets increases from 0.70 to just 0.71 (0.13 to 0.45).
- Average beta relative to the world market across developed (emerging) markets increases from 1.27 to 1.50 (0.09 to 0.94).
- Average idiosyncratic volatility across developed (emerging) markets increases from 0.08 to 0.09 (decreases from 0.18 to 0.12).
- For currency exchange markets:
- Average return correlation across developed (emerging) markets increases from 0.48 to 0.68 (0.22 to 0.50).
- Average beta relative to the world market across developed (emerging) markets increases from 0.55 to 0.98 (0.38 to 0.87).
- Average idiosyncratic volatility across developed (emerging) markets is unchanged at 0.07 (decreases from 0.13 to 0.11).
- For equity markets:
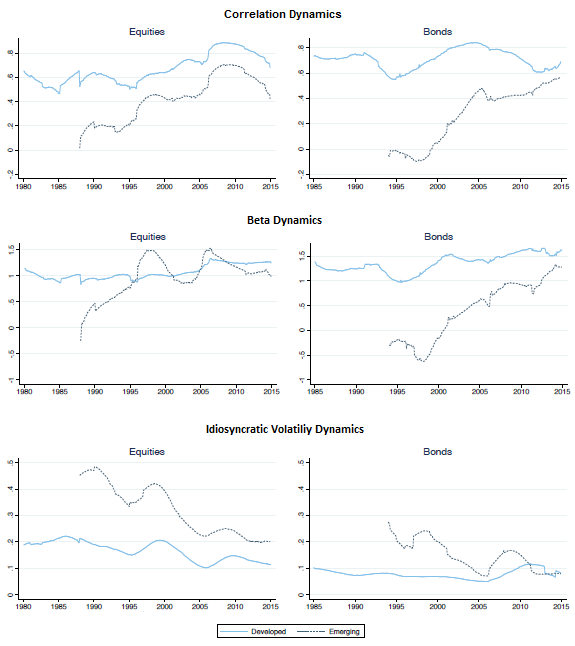
- More granular measurements based on 5-year rolling windows confirm the second half-first half findings but reveal additional detail, such as a decrease in average equity market return correlations since the financial crisis (see the charts below).
The following charts, taken from the paper, summarizes globalization dynamics (equally weighted average pairwise correlation, average beta relative to the world market and average idiosyncratic volatility) for developed and emerging equity and bond markets over available sample periods. Each measurement represents the center point of a rolling 5-year subsample (30 months before and after).
Results mostly indicate increases in market comovements over time, more dramatically for emerging markets than developed markets. However, trends are not steady.
The paper presents an additional set of three charts for foreign exchange.
In summary, while most evidence indicates increasing comovement of returns within global equity, bond and currency exchange markets, comovement relationships are dynamic over time and differ by asset class and metric.
In other words, metrics commonly used to implement global diversification indicate that:
- Geographic diversification is generally becoming more difficult to achieve.
- Diversification is not stable over 5-year horizons.
Cautions regarding findings include:
- Available data vary by developed and emerging markets and by asset class, interfering with comparisons.
- Data are unavailable for some country-asset class combinations.
- Samples are very short for some other country-asset class combinations, with start dates as late as February 2008.
- Because of the 2.5-year look-ahead for each measurement in the charts above, an investor operating in real time could not know the results. Calculations based purely on past data would differ.
Compare findings with past research via “global diversification”.