Is there a straightforward way to interpret the state of the yield curve as a manifestation of how efficiently the economy is processing information? In his March 2017 paper entitled “Simple New Method to Predict Bear Markets (The Entropic Linkage between Equity and Bond Market Dynamics)”, Edgar Parker Jr. presents and tests a way to understand interaction between bond and equity markets based on arrival and consumption of economic information. He employs Shannon entropy to model the economy’s implied information processing ratio (R/C), with interpretations as follows:
- R/C ≈ 1: healthy continuously upward-sloping yield curve when information arrival and consumption rates are approximately equal.
- R/C >> 1: low end of the yield curve inverts when information is arriving much faster than it can be consumed.
- R/C << 1: high end of the yield curve inverts when information is arriving much slower than it can be consumed.
Under the latter two conditions, massive information loss (entropy growth) occurs, and firms cannot confidently plan. These conditions delay/depress economic growth and produce equity bear markets. He tests this approach by matching actual yield curve data with standardized (normal) R and C distributions that both have zero mean and standard deviation one (such that standardized R and C may be negative). Using daily yields for U.S. Treasuries across durations and daily S&P 500 Index levels during 1990 through 2016, he finds that:
- Standardized R/C is stable most of the time but becomes unstable in 2000-2001 and 2006-2007.
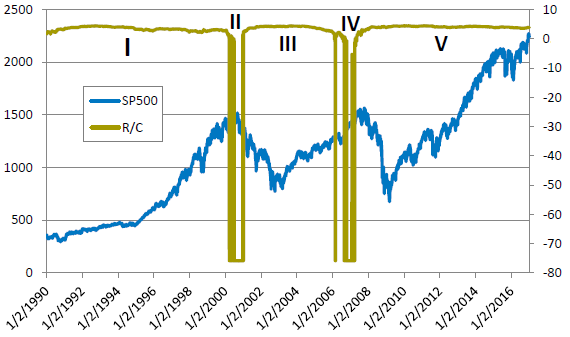
- Equity bear markets commence during or soon after incidences of R/C instability (see the chart below).
The following chart, taken from the paper, tracks the S&P 500 Index and standardized R/C across five subperiods during the test sample. During bull markets in subperiods I, III and V, R/C is stable as the economy efficiently processes available information. During subperiods II and IV, R/C changes dramatically as the relationship between information arrival and consumption becomes unbalanced. Equity bear markets soon follow.
In summary, evidence suggests that the shape of the U.S. Treasuries yield curve represents the level of information processing efficiency within the U.S. economy.
Cautions regarding findings include:
- The sample period is extremely small in terms of number of economic regimes and number of equity bear markets.
- The study does not test any market timing strategy for exploiting R/C signals. In fact, the approach seems to give “all clear” indications before much or any of equity bear markets materialize. Viewed differently, the indicator appears to give only imprecise U.S. stock market exit signals, not re-entry signals.