Are mean-variance (MV) strategies preferable for allocations to asset classes and equal-weight (EW) preferable for allocations to much noisier individual assets? In their May 2019 paper entitled “Horses for Courses: Mean-Variance for Asset Allocation and 1/N for Stock Selection”, Emmanouil Platanakis, Charles Sutcliffe and Xiaoxia Ye address this question. They focus on the Bayes-Stein shrinkage MV strategy, with 10 U.S. equity sector indexes as asset classes and the 10 stocks with the largest initial market capitalizations within each sector (except only three for telecommunications) as individual assets. The Bayes–Stein shrinkage approach dampens the typically large effects of return estimation errors on MV allocations. For estimation of MV return and return covariance inputs, they use an expanding (inception-to-date) 12-month historical window. They focus on one-month-ahead performances of portfolios formed in four ways via a 2-stage process:
- MV-EW, which uses MV to determine sector allocations and EW to determine stock allocations within sectors.
- EW-EW, which uses EW for both deteriminations.
- EW-MV, which uses EW to determine sector allocations and MV to determine stock allocations within sectors.
- MV-MV, which uses MV for both deteriminations.
They consider four net performance metrics: annualized certainty equivalent return (CER) gain for moderately risk-averse investors; annualized Sharpe ratio (reward for risk); Omega ratio (average gain to average loss); and, Dowd ratio (reward for value at risk). They assume constant trading frictions of 0.5% of value traded. They perform robustness tests for U.S. data by using alternative MV strategies, different parameter settings and simulations. They perform a global robustness test using value-weighted equity indexes for UK, U.S., Germany, Switzerland, France, Canada and Brazil as asset classes and the 10 stocks with the largest initial market capitalizations within each index as individual assets (all in U.S. dollars). Using monthly total returns for asset classes and individual assets as specified and 1-month U.S. Treasury bill yield as the risk-free rate during January 1994 through August 2017, they find that:
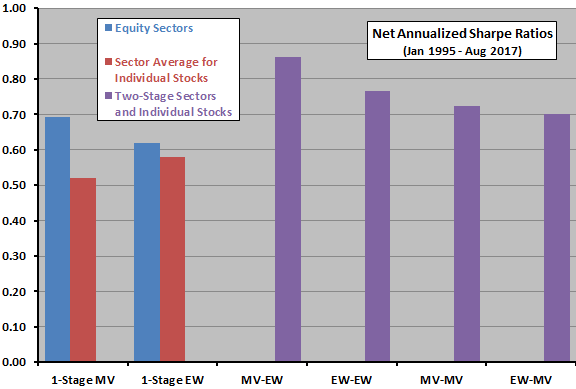
- For U.S. data and the baseline MV strategy, MV-EW wins all four performance metrics (see, for example, Sharpe ratio results in the chart below). EW-MV is the worst of the 2-stage allocation approaches.
- Simulations calibrated with U.S. data confirm that:
- MV beats EW for sector allocations.
- EW beats MV for individual stock allocations.
- The selected Bayes-Stein shrinkage strategy beats other widely used MV strategies.
- Results are robust to varying model and performance metric parameter values.
- Findings are similar for tests repeated on the specified global equity indexes and component stocks.
The following chart, constructed from findings in the paper, compares net annualized Sharpe ratios for the four 2-stage allocations described above, plus 1-stage allocations for equity sectors alone or stocks within sectors alone over the full sample period. Notable findings are:
- All 2-stage allocation approaches beat the 1-stage approaches.
- MV-EW is the optimal 2-stage approach.
In summary, evidence indicates that mean-variance optimization beats equal weighting for relatively low-variance equity indexes, but the reverse holds for relatively high-variance individual stocks.
Cautions regarding findings include:
- Analyses do not account for:
- Any costs of creating liquid funds from U.S. equity sector indexes or global equity indexes. To the extent these costs vary across indexes, these costs may affect allocations.
- Any costs of data acquisition/processing for MV.
- Testing multiple allocation strategies on the same sample introduces data snooping bias, such that results for the best strategy overstate expectations.
- Findings may not translate to non-equity asset classes and assets.