Does trading in exchange-traded funds (ETF) by authorized participants (who may create and redeem ETF shares by exchanging underlying assets) predict associated ETF returns? In their November 2016 draft paper entitled “ETF Arbitrage and Return Predictability”, David Brown, Shaun Davies and Matthew Ringgenberg examine the relationship between ETF share creation/redemption and ETF returns. For their principal analysis, they each week or each month rank ETFs into fifths (quintiles) based on change in shares outstanding and then calculate future returns by value-weighted or equal-weighted quintile. Using daily prices, share creation/redemption data, net asset values, volumes, bid-ask spreads, underlying asset characteristics and fund characteristics for approximately 1,200 ETFs, along with contemporaneous equity factor model returns, during January 2007 through December 2015, they find that:
- A strategy which buys (sells) the quintile of ETFs with the most shares redeemed (created) generates gross annualized 4-factor (market, size, book-to-market, momentum) alphas of 5% to 13% over the sample period, depending on weekly or monthly quintile reformation, value weighting or equal weighting, and exclusion of immature funds.
- Return predictability is strongest for the most liquid ETFs (easiest to short, smallest bid-ask spreads and highest volumes).
- Results are qualitatively similar for raw returns, 3-factor (market, size, book-to-market) alpha and 5-factor (adding profitability and investment) alpha.
- In general, ETFs generate abnormally low returns following inflows and abnormally high returns following outflows, affecting the average experience of traders (see the chart below). For example, the average flow-adjusted return for SPDR S&P 500 (SPY) is 4.96%, compared to an estimated 5.62% total return for its underlying assets. The average annual performance shortfall of 0.66% is much larger than SPY’s 0.09% annual fee.
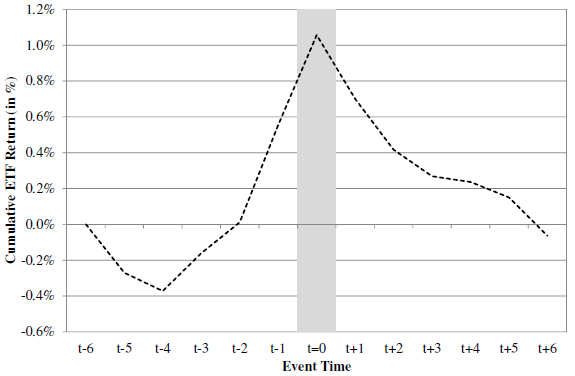
The following chart, taken from the paper, tracks value-weighted cumulative abnormal return for the quintile of mature ETFs with the highest share creations from six months before (t-6) to six months after (t+6) quintile formation (t=0) over the 2007-2015 sample period. Abnormal means relative to the value-weighted average return of all mature ETFs. As money flows in, cumulative abnormal return increases to over 1%, but then completely reverses by t+6. In other words, a month of ETF crowding pushes prices above fundamental value, with subsequent slower reversal as crowding subsides.
In summary, evidence indicates that unusual ETF inflows and outflows drive fund prices from fundamental value even when arbitrageurs are actively creating and redeeming ETF shares.
Cautions regarding findings include:
- Returns and alphas are gross, not net. Accounting for trading frictions associated with weekly or monthly ETF portfolio reformation and shorting costs would dampen results.
- As noted in the paper, value weighting tends to concentrate any effects on a relatively few underlying assets because of similarities among the largest ETFs.
- ETF share creation/redemption activities are not readily available to investors.
- While relative performance of ETFs is available, the study does not test exploitability of the event study pattern in the figure above.