Do stocks entering (exiting) factor indexes experience a price jump (drop) due to increased (decreased) demand? In their October 2016 paper entitled “Price Response to Factor Index Decompositions”, Joop Huij and Georgi Kyosev examine price impacts for stocks entering and exiting MSCI Minimum Volatility factor indexes covering U.S., European, global and emerging markets. To isolate the factor index effect, they exclude changes affecting both a factor index and its parent broad market index and changes due to corporate actions (such as spin-off or acquisition). They distinguish between the effective day (ED) of a change (first day the change occurs in the index portfolio) and the announcement day (AD) of a change (nine business days before ED). They define daily abnormal return of a stock as return in excess of the return of its factor index. They define daily abnormal trading volume of a stock as the ratio of dollar trading volume of the stock to dollar trading volume of its factor index, multiplied by the ratio of average dollar trading volume of the index to average dollar trading volume of the stock during a 40-day window ending 10 days before AD. Using index changes and daily returns and trading volumes of all stocks in the Minimum Volatility factor indexes and their parent broad market indexes during November 2010 through December 2015 (11 index rebalancings), they find that:
- On average, the MSCI Minimum Volatility factor indexes have 183 stocks with 20 additions and 14 deletions per rebalancing, translating to 9.6% and 6.8% of the portfolio, respectively.
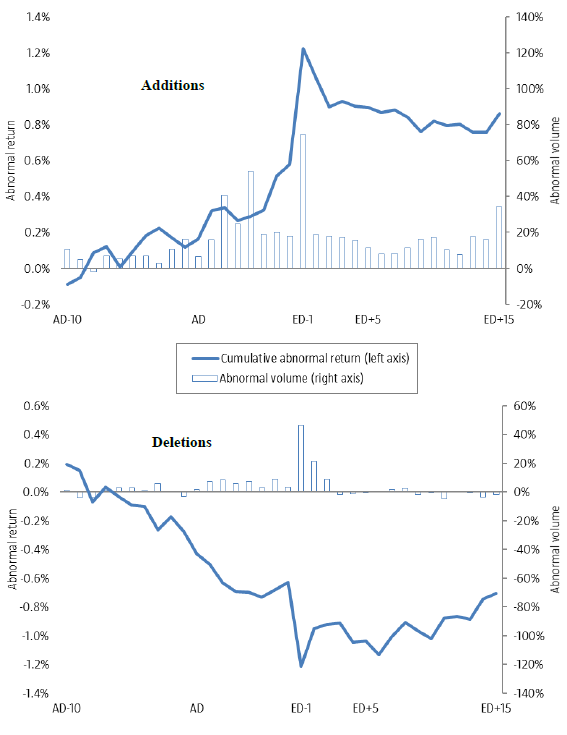
- For factor index additions (see the first chart below):
- Cumulative abnormal return (CAR) is positive from AD to ED for 62% of additions.
- Average CAR from AD to ED is 1.07%.
- Average abnormal return is 0.63% on the day before ED.
- Average reversal during the five days after ED is -0.31%, indicating that about two thirds of the addition effect is permanent.
- Average trading volume is 1.3 times normal between AD and ED, peaking at 1.74 the day before ED and then slowly receding to 1.15 three weeks after ED.
- For factor index deletions (see the second chart below):
- Average CAR from AD to ED is -0.91%.
- 64% of deletions have negative return on the day before ED, with average return -0.57%.
- Average reversal during the three weeks after ED is +0.49%, indicating that about half of the deletion effect is permanent.
- Average abnormal trading volume peaks at 1.46 times normal on the day before ED.
- In aggregate over time, the addition/deletion effect represents a 0.16% annual rebalancing drag on the factor index portfolios.
The following charts, taken from the paper, track average CARs and abnormal trading volumes for additions to (upper chart) and deletions from (lower chart) MSCI Minimum Volatility factor indexes from 10 trading days before AD (AD-10) through 15 trading days after ED (ED+15) over the November 2010-December 2015 sample period. Results show that both CAR and abnormal trading volume effects peak on the day before ED and then experience partial reversals.
In summary, evidence indicates that adding (deleting) stocks from factor indexes stimulates (depresses) demand for these stocks and thereby induces a partly permanent increase (decrease) in their prices. The effect peaks the day before actual changes to the indexes.
Cautions regarding findings include:
- Computed returns are gross, not net. Exploitation of the effect would involve trading frictions and shorting costs that would reduce these returns.
- The study does not test any strategies for exploiting the effect. Variability in returns may undermine reliable exploitation. Also, opportunities occur only twice a year and overlap, complicating capital management.