A subscriber requested review of a finding that deviation of 10-year constant maturity U.S. Treasury note (T-note) yield from an intermediate-term linear trend predicts U.S. stock market return. Specifically, when weekly yield is more than one standard deviation of weekly trend divergences below (above) a weekly 70-week linear extrapolation, next-week S&P 500 Index return is on average unusually high (low). To confirm and test usefulness of this finding, we each week:
- Perform a linear extrapolation of past T-note yields to forecast next-week T-note yield, but using a 52-week rolling window rather than a 70-week window. A 52-week lookback aligns with an annual inflation cycle, while a 70-week lookback seems arbitrary and may be snooped.
- Calculate the difference between next-week actual and forecasted T-note yields.
- Calculate the standard deviation of these differences over the 52-week rolling window.
We then segment weekly actual minus forecasted T-note yield differences into: those more than one standard deviation below forecasted yield (Below Lower); those between one standard deviation below and above forecasted yield (Between); and, those more than one standard deviation above forecasted yield (Above Upper). Next, we calculate next-week S&P 500 Index returns for these three segments. Limited by availability of weekly T-note yield data, return calculations commence January 1964. To check robustness of results, we also consider a recent subsample commencing January 2008. To test economic value of findings, we examine a Dynamic Weighted strategy that modifies a benchmark 60% allocation to SPDR S&P 500 (SPY) and 40% allocation to iShares Barclays 7-10 Year Treasuries (IEF), rebalanced weekly, to 80% SPY when T-note condition the prior week is Below Lower and 40% SPY when Above Upper. The strategy backtest commences with inception of IEF at the end of July 2002 and focuses on weekly return statistics, compound annual growth rate (CAGR) and maximum drawdown (MaxDD), ignoring rebalancing/reallocation frictions. Using weekly T-note yields (average of daily values measured on Friday) and contemporaneous S&P 500 Index levels since January 1962, and weekly dividend-adjusted levels of SPY and IEF since July 2002, all through January 2018, we find that:
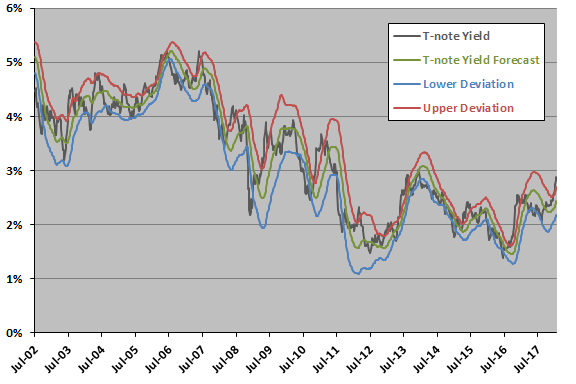
The following chart illustrates outputs of the three preliminary calculation steps outlined above since July 2002, showing actual weekly T-note yield, weekly T-note yield forecast, and one standard deviation of weekly differences between actual and forecasted yields below (Lower Deviation) and above (Upper Deviation) the forecasted yield.
Over the full sample period actual yield spends about 20% of the time below Lower Deviation, 60% of the time between deviation lines and 20% of the time above Upper Deviation.
How do next-week S&P 500 Index returns differ for these three conditions?
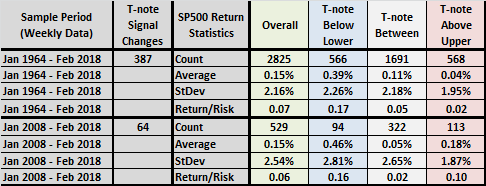
The following table summarizes S&P 500 Index average next-week returns, standard deviations (StDev) of next-week returns and ratios of average next-week return to standard deviation (Return/Risk) for all weeks (Overall) and for the three T-note yield conditions over the full sample period and during the subperiod since January 2008. Notable points are:
- For both the full sample and the recent subsample, average returns are higher than Overall and somewhat more volatile when actual T-note yield is Below Lower.
- For the full sample, average returns are lower than Overall and somewhat less volatile when actual T-note yield is Above Upper. However, this finding does not hold for the recent subsample.
- For both the full sample and the recent subsample, average returns are lower than Overall when actual T-note yield is Between.
The table also shows that there are a daunting 387 (64) changes in T-note deviation conditions for the full sample (recent subsample).
What happens to T-note price during the three conditions?
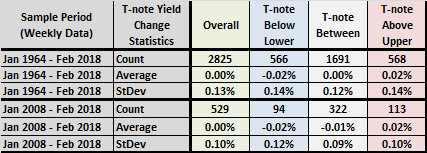
The next table summarizes average next-week changes in T-note yield and standard deviations of next-week changes in yield for all weeks (Overall) and for the three T-note yield conditions over the full sample period and during the subperiod since January 2008. For both the full sample and the recent subsample, average changes in yield are:
- Zero overall.
- Negative when Below Lower (T-notes tend to have capital gains).
- Positive when Above Upper (T-notes tend to have capital losses).
These results indicate that T-note capital gains/losses work against exploitation of equity returns due to tilting away from (toward) T-notes when Below Lower (Above Upper).
Next, we test economic significance of findings.
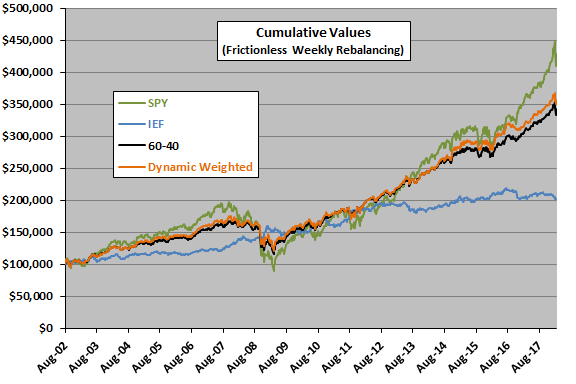
The following chart compares the gross cumulative values of $100,000 initial investments in SPY, IEF, the weekly rebalanced 60-40 SPY-IEF benchmark and the weekly rebalanced Dynamic Weighted timing strategy specified above since inception of IEF. Dynamic Weighted mostly offers slight outperformance relative to the 60-40 benchmark.
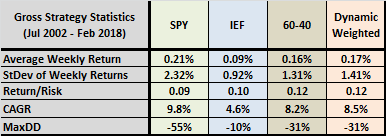
For additional perspective, we look at basic performance statistics.
The final table compares weekly and overall gross performance statistics for SPY, IEF, the weekly rebalanced 60-40 SPY-IEF benchmark and the weekly rebalanced Dynamic Weighted timing strategy over the available sample period. Dynamic Weighted generates a modestly higher CAGR than the 60-40 benchmark at the same level of risk (Return/Risk and MaxDD).
There are on average about seven T-note condition changes per year, such that incremental portfolio turnover for Dynamic Weighted may generate trading frictions that would offset this improvement.
Using a more extreme 100-0 SPY-IEF for Below Lower and 20-80 when Above Upper boosts Dynamic Weighted gross CAGR to 8.8% but lowers weekly Return/Risk to 0.11.
In summary, evidence indicates that the signals derived from deviation of T-note yield from weekly forecasts based on intermediate-term linear extrapolations has some power to predict S&P 500 Index weekly returns, but results from a simple strategy to exploit predictability are not compelling.
Cautions regarding findings include:
- All findings are gross, not net. Weekly rebalancing of 60-40 and Dynamic Weighted portfolios would generate material frictions. As noted, reallocations based on weekly T-note conditions would likely increase frictions and may offset any improvements offered by Dynamic Weighted.
- A 52-week lookback for T-note yield extrapolation and standard deviation calculations may not be optimal. However, as noted, the original 70-week interval may be snooped.
- The available sample period for the SPY-IEF test is not long in terms of variety of market/economic conditions.