Do the realities of trading (bids and asks, stale prices, large orders, noise traders and technical traders) that may drive asset price away from fundamental value affect some stocks more than others? If so, is the effect exploitable? In their October 2016 draft paper entitled “(Priced) Frictions”, Kewei Hou, Sehoon Kim and Ingrid Werner assess the impact of such microstructure frictions on the cross-section of stock returns. Using a rolling 250-day window, they first estimate a stock’s friction-free average daily return as average two-day return divided by average lagged one-day return. They then compute the stock’s microstructure friction (FRIC) as average daily return minus friction-free average daily return over the same 250-day rolling window. To explore cross-sectional effects, they each month sort stocks into tenths (deciles) based on FRIC and construct a hedge portfolio that is long the high-FRIC decile and short the low-FRIC decile. They also perform double-sorts of FRIC and other stock return factors/predictors into fifths (quintiles) to investigate interactions. Using daily returns and firm data for a broad sample of U.S. stocks, and monthly returns for various stock return factors/predictors, during July 1963 through June 2013, they find that:
- The FRIC hedge portfolio generates monthly gross value-weighted (equal-weighted) average return 0.82% (1.27%), or 10.3% (16.3%) annualized.
- For various 3-factor, 4-factor and 5-factor models of stock returns, the FRIC hedge portfolio generates monthly gross value-weighted (equal-weighted) alphas in the range 0.58% to 0.76% (1.16% to 1.32%).
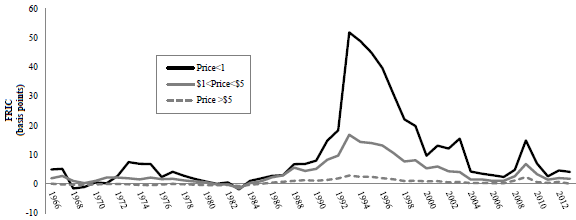
- Aggregate (market-wide average) FRIC varies considerably, spiking during 1974-1975 and 1990-1991 recessions, the late 1990s technology bubble and the 2007-2009 financial crisis. These spikes concentrate among low-price stocks (see the chart below).
- The FRIC premium is much stronger among stocks that are small, value, low-momentum, volatile, high-accrual, low-asset growth and low-profitability. It is also more pronounced among illiquid firms as measured by low dollar trading volume, large bid-ask spread, low turnover, low price and many non-trading days. For example, based on quintile double-sorts and equal weighting, high-FRIC stocks outperform low-FRIC stocks by:
- 1.42% (0.17%) among the smallest (largest) stocks.
- 2.01% (0.50%) among stocks with the lowest (highest) momentum.
- 2.14% (0.07%) among stocks with the highest (lowest) idiosyncratic volatility.
- 1.55% (-0.08%) among stocks with the lowest (highest) prices.
- FRIC appears to contain more information about future returns than conventional liquidity measures. For example, using high FRIC and low price separately to screen out low-liquidity stocks in equal numbers results in average monthly gross equal-weighted momentum hedge portfolio returns of 0.89% and 1.31%, respectively.
- Findings are robust to alternative variable definitions, subperiods and subsamples.
- Analysis of UK data indicates that FRIC is useful when other liquidity measures (trading volume, bid and ask prices and intraday high-low prices) are unavailable.
The following chart, taken from the paper, illustrates the relationship between annual aggregate FRIC and stock price range over the sample period. To calculate aggregate FRIC, the authors first average monthly FRIC for each stock within a year and then average FRICs across stocks. Results indicate that spikes in aggregate FRIC concentrate in low-price stocks.
In summary, evidence indicates that FRIC may be useful for identifying low-liquidity stocks and therefore in estimating accessible premiums of various stock return factors/predictors (by screening out high-FRIC stocks).
Cautions regarding findings include:
- Reported returns are gross, not net. Accounting for trading frictions and shorting costs would reduce these returns. Moreover:
- High-FRIC stocks may not be available for shorting (no shares to borrow).
- High-FRIC stocks likely bear very high trading frictions.
- FRIC calculations involve considerable data collection/processing. Investors would bear fees for delegating such efforts to an investment manager/fund.