What is the state of the equity risk premium across global markets? In the October 2011 version of their paper entitled “Equity Premia Around the World”, Elroy Dimson, Paul Marsh, and Mike Staunton update their estimates of equity risk premiums for 19 country markets and a worldwide aggregate relative to both short-term government bills and long-term government bonds over a period of 111 years. They report local currency and dollar-based real returns and the historical equity premium for each country, and they decompose the premium into dividends, dividend growth, multiple expansion and change in real exchange rate. All aggregates are value-weighted. Using stock, bond, bill, inflation and currency returns for the period 1900 through 2010, they find that:
- The terminal values of $1 initial investments at the beginning of 1900 in dividend-reinvested U.S. stocks, bonds and bills as of the end of 2010 are $21,766, $191 and $74, respectively, representing annualized nominal returns of 9.4%, 4.8% and 3.9%. Respective annualized real returns are 6.3%, 1.8% and 1.0%. Dividends (capital gains) drive 4.4% (1.9%) of the annualized real equity market return.
- Annualized real equity market returns range from 3.0% to 6.0% across 19 country markets (5.0% worldwide), consistently beating returns of local bonds and bills (which are not always positive).
- Volatility (annual standard deviation) of nominal U.S. equity market returns is 20.3%, compared to 17.7% for equities worldwide.
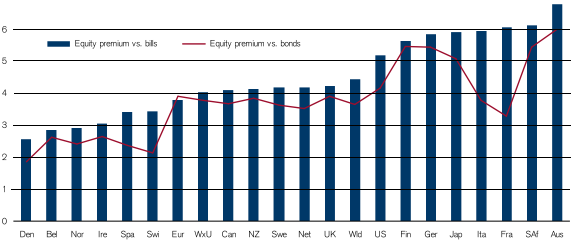
- The annualized historical worldwide equity premium over U.S. Treasury bills (bonds) for 1900-2010 is 4.5% (3.8%). The U.S. moderately outperforms this worldwide result (see the chart below.)
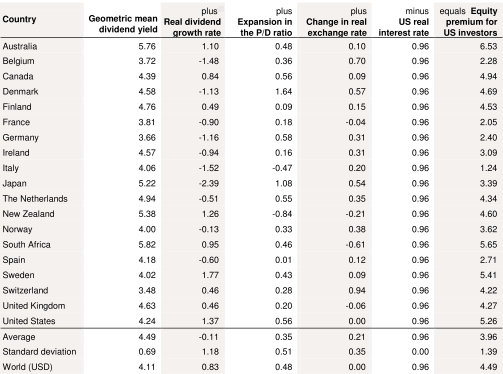
- For all 19 countries, dividend yields dominate equity market returns and premiums (see the table below).
- The prospective worldwide equity risk premium is about 3.0%-3.5% (4.5%-5.0%) on a geometric (arithmetic) mean basis.
The following chart, taken from the paper, shows the annualized (geometric mean) historical equity premiums relative to both bills and bonds over 1900-2010 for 19 countries, the worldwide (Wld) and the worldwide excluding the U.S. (WxU). It shows that equities outperform both bills and bonds in all 19 countries. Relative to bills (bonds), the equity risk premium is 5.3% (4.4%) for the U.S., compared to an average 4.6% (3.8%) for all countries and a value-weighted 4.5% (3.8%) worldwide. (For Germany, results exclude 1922-1923, during which hyperinflation destroyed the value of local bills and bonds.)

The following table, also from the paper, decomposes the equity premium from the perspective of a U.S. investor for all 19 countries and worldwide over 1900–2010 into four components: (1) annualized dividend yield; (2) growth rate of real dividends; (3) expansion in the price/dividend multiple; and, (4) long-term change in the real (inflation-adjusted) exchange rate. Over the last 111 years, dividend yields dominate returns, but price/dividend ratios have risen (dividend yields have fallen) in all but two countries.

In summary, expert review of historical data suggests that investors should expect an equity premium in mid-single digits across markets in all countries over the very long term.
Cautions regarding findings include:
- Escalating displacement of dividends by stock buybacks over the past three decades may be disrupting some of the above metrics.
- The implicit assumptions of buy-and-hold investing and reinvestment of dividends may not represent actual or realistically theoretical investor risk premium experience due to poor aggregate investor timing and insufficient supply of stock to absorb reinvestment of all dividends.