Does uncertainty about future firm earnings underlie stock factor returns? In their August 2017 paper entitled “Uncertainty, Momentum, and Profitability”, Claire Liang, Zhenyang Tang and Xiaowei Xu examine relationships between analyst uncertainty about current-year firm earnings and four U.S. stock return anomalies. They each month estimate uncertainty for each stock as square root of the average squared differences between individual analyst forecasts for current-year earnings and reported earnings per share, divided by stock price. They then each month sort firms into fifths (quintiles) by:
- Uncertainty – as specified.
- Price momentum – stock returns from 12 months ago to one month ago.
- Earnings momentum – most recently announced quarterly earnings minus earnings from the same quarter one year ago, divided by the standard deviation of seasonal differences in earnings for the previous eight quarters.
- Operating profitability – annual revenue minus cost of goods sold, interest expense and selling, general, and administrative expenses, divided by book equity for the last fiscal year.
- Return on equity – earnings before extraordinary items from the most recent quarter divided by prior-quarter book equity.
They calculate gross monthly returns for each factor via an equal-weighted or value-weighted hedge portfolio that is each month long (short) the quintile of stocks with the highest (lowest) factor values. They test the power of uncertainty to explain other factor returns via regressions against uncertainty factor returns. Since some stocks may not have analyst coverage, they test whether idiosyncratic volatility and earnings forecast dispersion are effective substitutes for uncertainty. Using the specified monthly data for all NYSE/AMEX/NASDAQ stocks priced at least $1 during 1983 through 2013, they find that:
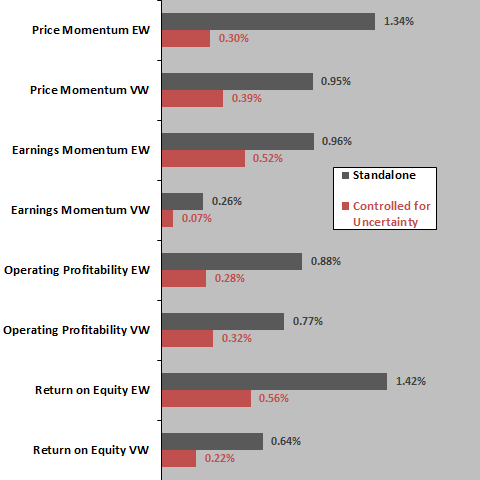
- After controlling for uncertainty factor returns, those for price momentum and operating profit (whether equal-weighted or value-weighted) shrink to statistical insignificance, as do those for value-weighted earnings momentum and return on equity (see the chart below). Specifically, when not controlling for (controlling for) uncertainty factor returns, average equal-weighted gross monthly return for:
- Price momentum is 1.34% (0.30%)
- Earnings momentum is 0.96% (0.52%)
- Operating profitability is 0.88% (0.28%)
- Return on equity is 1.42% (0.56%).
- Consistent with uncertainty as an underlying driver, average returns for the four anomalies concentrate when overall stock market returns are negative. Specifically, when monthly market returns are positive (negative), average equal-weighted gross monthly return for:
- Price momentum is 0.52% (2.68%)
- Earnings momentum is 0.60% (1.54%)
- Operating profitability is -0.67% (3.44%)
- Return on equity is -0.08% (3.88%).
- Idiosyncratic volatility is an effective substitute for uncertainty with respect to the profitability factors, but not for the momentum factors. Earnings forecast dispersion is generally not an effective substitute for uncertainty.
The following chart, constructed from data in the paper, summarizes effects on price momentum, earnings momentum, operating profitability and return on equity factor returns, whether calculated via equal-weighted (EW) or value-weighted (VW) hedge portfolios, before and after controlling for uncertainty factor returns. Results indicate that all four factors interact strongly with the uncertainty factor.
In summary, evidence suggests that the uncertainty factor may be of broader import than conventional momentum and profitability factors in the construction of factor (smart beta) portfolios.
Cautions regarding findings include:
- Reported returns are gross, not net. Accounting for monthly portfolio reformation frictions and shorting costs would reduce all returns. Moreover:
- These costs may differ across factors, such that their net relative performance may differ from the reported gross relative performance.
- Shorting of some stocks as specified may not be feasible due to lack of shares to borrow, such that investors cannot exploit short sides of factor portfolios as specified.
- Monthly data collection/processing for uncertainty factor calculations and associated portfolio maintenance are beyond the reach of many investors, who would bear fees for delegating to a fund manager.