A subscriber suggested evaluation of average investor allocation to stocks as “The Single Greatest Predictor of Future Stock Market Returns”. For this evaluation, we test simple ways to time the broad U.S. stock market using the quarterly time series for average U.S. investor allocation to stocks as provided in the article. We assume that the dates in this series are the first days of measured quarters. Using this quarterly series and the contemporaneous S&P 500 Index during December 1951 through September 2014, and quarterly dividend-adjusted returns for SPDR S&P 500 ETF (SPY) and contemporaneous 13-week U.S. Treasury bill (T-bill) yields during March 1993 through September 2014, we find that:
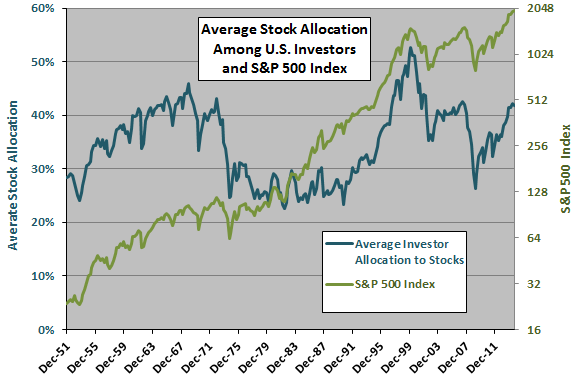
The following chart depicts average U.S. investor allocation to stocks as estimated in the article (left axis) and the contemporaneous S&P 500 Index on a logarithmic scale (right axis) over the entire sample period. Visual inspection suggests that the two series often move together and that the steepest stock market gains tend to occur when allocation to stocks is relatively low.
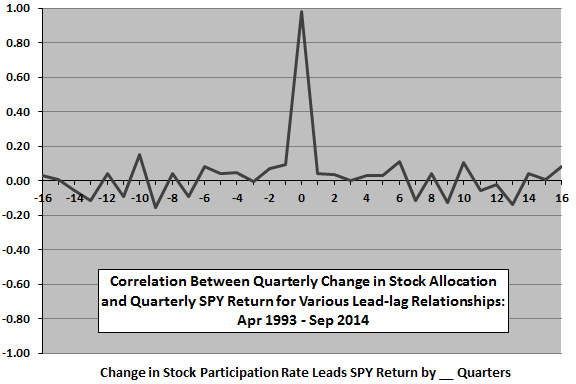
For precision, we look at lead-lag correlations between change in stock allocation and SPY return.
The next chart shows correlations between quarterly change in average stock allocation and quarterly SPY return for lead-lag relationships ranging from SPY return leads change in stock allocation by 16 quarters (-16) to stock allocation leads SPY return by 16 quarters (16). Results indicate that the relationship is very strongly coincident and any lead-lag relationships are probably noise. In other words, the informativeness of quarterly change in average stock allocation is nearly identical to that of concurrent stock market return.
Nevertheless, because of the author’s claim that average stock allocation is the single greatest predictor of future stock market returns, we test some simple strategies that time SPY based on this variable.
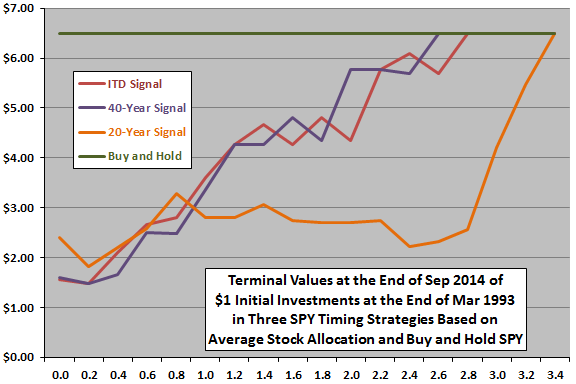
The final chart summarizes terminal values of $1 initial investments in each of four simple strategies:
- Inception-to-Date (ITD) Signal – each quarter, hold SPY (T-bills) when the prior-quarter average stock allocation is below (above) its ITD average quarterly value plus 0.0 to 3.4 times its ITD quarterly standard deviation.
- 40-Year Signal – each quarter, hold SPY (T-bills) when the prior-quarter average stock allocation is below (above) its average quarterly value over the last 40 years plus 0.0 to 3.4 times its quarterly standard deviation over the past 40 years.
- 20-Year Signal – each quarter, hold SPY (T-bills) when the prior-quarter average stock allocation is below (above) its average quarterly value over the last 20 years plus 0.0 to 3.4 times its quarterly standard deviation over the past 20 years.
- Buy and Hold – buy and hold SPY.
The horizontal axis represents different multiples of the quarterly standard deviation of average stock allocation. For 0.0, the threshold for switching between SPY and T-bills is just the past average of average stock allocation. For values greater than 0.0, the threshold is higher (the timing strategy is in the market more often).
For this test, we ignore trading frictions associated with switching between SPY and T-bills and with reinvestment of dividends. We also ignore tax implications of trading.
The terminal value for buying and holding SPY is $6.50. Results indicate that the 54 variations across the three SPY timing strategies at best match buying and holding SPY. The variations that match Buy and Hold do so only because the threshold for switching to T-bills is so high that no switches occur. All variations involving any switches between SPY and T-bills underperform Buy and Hold.
In summary, evidence from simple tests offers no support for a belief that average U.S. investor allocation to stocks is useful for timing the U.S. stock market.
Cautions regarding findings include:
- As noted, the above strategy outcomes are gross, not net. Accounting for trading frictions would lower terminal values of timing strategy variations that trigger any switches between SPY and T-bills.
- There may be some more complex market timing strategy for which average investor allocation to stocks is useful.
- However, calculation of the average investor allocation to stocks relies on government estimates of financial data rather than prices. Government agencies often issue both short-term revisions (reflecting updates to inputs) and long-term revisions (reflecting changes in estimation parameters) to such data, such that the as-revised historical series differ from data observed in real time.
See also “Usefulness of P/E10 as Stock Market Return Predictor”, which tests the usefulness of P/E10 (Cyclically Adjusted Price Earnings ratio, or CAPE) for timing the U.S. stock market.