Which firm profitability metric best predicts stock returns? In their May 2017 paper entitled “Alternative Profitability Measures and Cross Section of Expected Stock Returns: International Evidence”, Nusret Cakici, Sris Chatterjee and Yi Tang compare abilities of 12 profitability ratios to predict stock returns across four regions (North America, Europe, Japan and Asia-Pacific). They consider three measures of profitability: gross profit (GP); operating income (OI); and, earnings before interest and taxes (EBIT). They consider four scaling variables: enterprise value (EV); book value of assets (BA); market value of equity (ME); and, book value of equity (BE). Specifically, at the end of June each year, they rank stocks by region into fifths (quintiles) based on each of the 12 profitability metrics and hold the quintiles for one year. They measure the predictive power of each metric as average monthly return to a portfolio that is annually long (short) the top (bottom) quintile. Using firm accounting data and monthly stock returns for 23 developed country equity markets allocated to one of the four regions during January 1991 through December 2016, they find that:
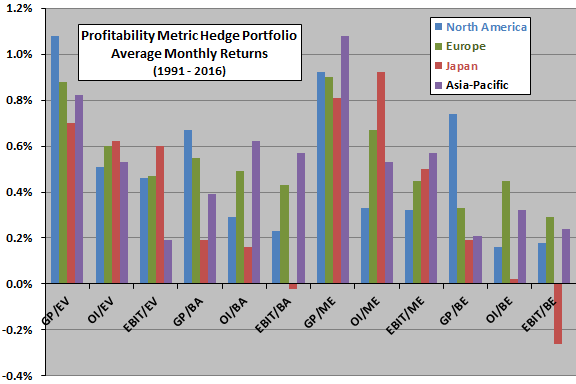
- The overall best profitability metric is GP/ME, following by GP/EV (see the chart below).
- The power of GP/ME to predict returns concentrates in small stocks, but average hedge portfolio return for this ratio is still sizable within big stocks.
- The 4-factor (market, size, book-to-market, momentum) model of stock returns does not explain the predictive power of profitability.
- Findings are consistent with beliefs that the success of GP/ME is due partly to choice of a “clean” measure of profit and partly to behavioral misvaluation of stocks.
The following chart, constructed from data in the paper, summarizes average gross monthly hedge portfolio returns for each of the 12 profitability metrics across the four geographical regions as specified above. Results indicate that GP/ME and GP/EV are the strongest and most consistent predictors of stock returns.
In summary, evidence from developed market stocks around the world indicates that gross profit divided by market value is the best profitability metric for screening stocks.
Cautions regarding findings include:
- The sample is short in terms of number of economic/market cycles.
- Average returns are gross, not net. Annual portfolio reformation frictions and shorting costs would reduce these returns. Shorting may be costly/infeasible for some stocks as specified due to lack of shares to borrow. These costs/constraints may vary by market. Concentration of predictability within small stocks exacerbates costs.
- Testing 48 combinations of metrics and regions introduces snooping bias, such that the best combinations overstate expectations.