Should investors go with or against asset pricing bubbles? Or, should they step aside and await a “Return to Normalcy?” In their December 2009 paper entitled “Riding Bubbles”, Nadja Guenster, Erik Kole and Ben Jacobsen investigate empirically the best approach for investors to take regarding active asset bubbles. They detect bubbles within rolling historical 10-year intervals based on two criteria: (1) price advances faster than growth rates of fundamental value based on three widely used asset pricing models; and, (2) sudden accelerations in price unexplained by these models. More descriptively, a bubble is a structural break followed by abnormally positive returns, and ended with a crash. Using monthly returns and contemporaneous fundamentals for 48 value-weighted industry indexes spanning July 1926 to December 2006, they conclude that:
- Bubbles are reasonably well-spread across the 48 industries, with an average of two bubbles per industry over the sample period. The typical industry bubble lasts about 30 months with a raw return of about 30% per year.
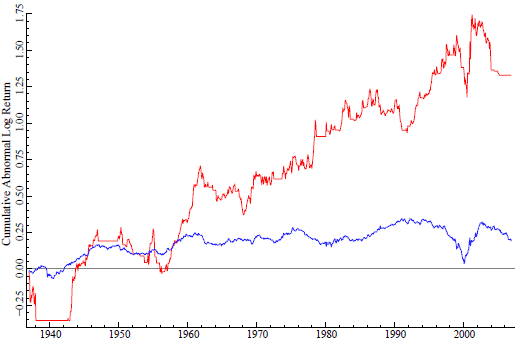
- The average abnormal return after bubble detection more than compensates for the risk of crash. An investment strategy that allocates funds equally to all industries in bubble mode (staying in cash the 30% of the time there are no industry bubbles), reformed monthly, generates an average annual abnormal return of 3% to 8% (depending on the asset pricing model used) over the sample period. (See the first chart below.)
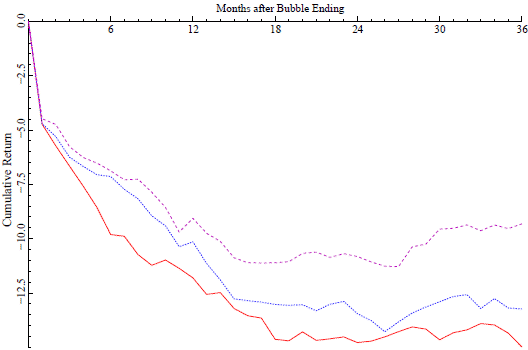
- After a bubble, there is a crash the first month, followed by a continuous decline over the next one to two years (see the second chart below).
- Neither specific industries nor a small subset of bubbles drives results.
The following chart, taken from the paper, shows the cumulative abnormal log return for an initial investment of $1 in a strategy that each month allocates funds equally to all industries in bubble mode during 1936 through 2006. Bubble detection and abnormal return for this chart are based on a four-factor (market, size, book-to-market, momentum) fundamental pricing model.

The next chart, also from the paper, shows average cumulative abnormal percentage returns for one to 36 months after the end of a bubble, using three different asset pricing models as indicators of departure from fundamental value. Month one is the first month after a sequence of consecutive bubble months that is no longer classified as belonging to the bubble.

In summary, evidence indicates that riding industry asset bubbles (guided only by information on returns and fundamentals from the past ten years) may be an attractive investing strategy. Evidence does not support shorting bubbles.