Does the level of cash held by a company, appropriately normalized for its business characteristics, reliably indicate the prospects for its stock? If so, is a high or low level of cash better for the stock? In his January 2009 paper entitled “Excess Cash Holdings, Risk, and Stock Returns”, Mikhail Simutin investigates the relationship between excess corporate cash holdings and future stock returns. He defines “excess” via multi-factor regression to normalize for key firm characteristics. Using characteristics, fundamentals and stock return data for non-financial U.S. companies over the period 1960-2006, he concludes that:
- The fifth of firms with the highest (lowest) excess cash holdings have about 33% (2%) of their total assets in cash.
- A hedge strategy that is long (short) the tenth of stocks with the highest (lowest) excess cash levels on a value-weighted basis, rebalanced monthly, earns an average 0.4% monthly return before trading costs across the entire sample period. The three-factor (market, size, book-to-market ) alpha is about 0.5% per month. Results are roughly consistent for 1960-1982 and 1983-2006 subperiods.
- High-cash firms tend to have higher market betas, underperforming low-cash firms by 0.37% per month during falling stock markets but outperforming by over 1% per month during advancing stock markets.
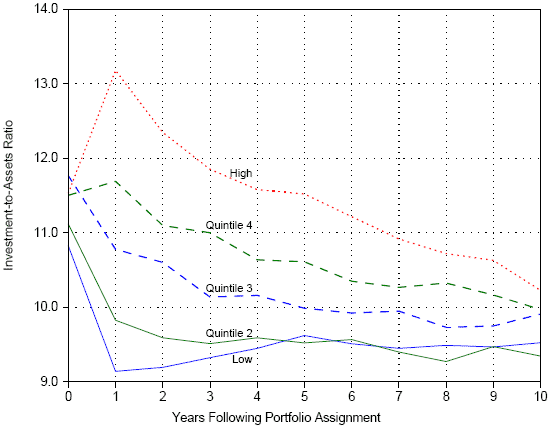
- Firms with high excess cash tend to exhibit high future investment (capital expenditures and acquisitions) but not strong future profitability, suggesting risky growth. (See the chart below.)
The following chart, taken from the paper, shows the average investment-to-assets ratios (in percent) over the ten years after sorting the sample of firms into fifths each year based on excess cash at year 0 throughout 1960-2006. Investment means capital expenditures plus acquisitions minus dispositions of property, plant and equipment. The chart shows that firms tend to use excess cash for “excess” investment over a period of years.

In summary, non-financial firms with high levels of cash tend to use the cash for risky growth, earning higher average stock returns with higher beta. Trading frictions from rebalancing to capture the abnormal returns would tend to offset the alpha.