Is the part of profitability based on cash flow more informative than the part based on accruals? In their March 2015 paper entitled “Accruals, Cash Flows, and Operating Profitability in the Cross Section of Stock Returns”, Ray Ball, Joseph Gerakos, Juhani Linnainmaa and Valeri Nikolaev investigate the power of the cash flow part of profitability to predict stock returns. They compare its predictive power to those of overall operating profitability and of the accruals part of profitability. Using monthly returns and annual firm accounting data (lagged six months) for a broad sample of U.S. common stocks during July 1963 through December 2013, they find that:
- Overall, the average annual operating profitability based on cash flow is 11.7% of total assets. The Pearson correlation between profitability based on cash flow and profitability based on accruals is -0.25.
- Profitability based on cash flow significantly outperforms operating profitability in predicting stock returns and subsumes the accruals anomaly.
- Average gross monthly three-factor (market, size, book-to-market) alpha for a hedge portfolio that is long (short) the tenth of stocks with the:
- Highest (lowest) past operating profitability is 0.75%.
- Lowest (highest) past profitability based on accruals only is 0.43%.
- Highest (lowest) profitability based on cash flow only is 0.90%.
- Including profitability factors boosts the gross mean-variance efficiency of an ideal portfolio constructed from conventional market, size, book-to-market and momentum factors. Specifically, gross annualized Sharpe ratios are:
- 0.39 for the market portfolio.
- 1.05 for a portfolio based on the four conventional factors.
- 1.15 for a portfolio that adds an accruals profitability factor to the four conventional factors.
- 1.43 for a portfolio that adds an operating profitability factor to the four conventional factors.
- 1.70 for a portfolio that adds a cash flow profitability factor to the four conventional factors.
- Profitability based on cash flow significantly predicts returns for ten years (as measured by lags in the predictive variable in six-month increments). In contrast, profitability based on accruals predicts returns just one year ahead with only marginal significance.
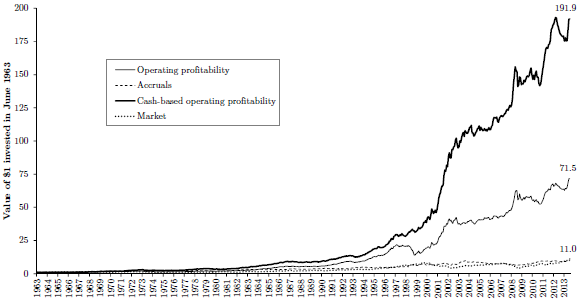
The following chart, taken from the paper, compares gross cumulative values of $1 initial investments in the three-factor alphas of value-weighted hedge portfolios that are each year long (short) the tenth of stocks with the highest (lowest) expected returns based on operating profitability, profitability based on accruals only and profitability based on cash flow only. Results represent the returns on strategies that trade each anomaly while neutral with respect to market, size and book-to-market factors. The value-weighted market benchmark uses returns in excess of the one-month U.S. Treasury bill yield.
Results indicate that operating profitability based on cash flow outperforms other profitability measures after adjusting for market, size and book-to-market factor risks.

In summary, evidence indicates that a profitability variable based only on cash flow (excluding accruals) is a better predictor of annual and long-term returns for U.S. stocks than operating profitability and subsumes the accruals anomaly.
Cautions regarding findings include:
- Calculations in the study are gross, not net. Accounting for costs of annual portfolio reformation and continuous shorting would reduce reported performance. The relatively infrequent annual portfolio reformation mitigates concern about costs of portfolio turnover (but not shorting costs). Shorting of some stocks as assumed may not be feasible.
- Portfolio tests are ideal (incorporating look-ahead bias), such that results overstate reasonably expected performance.
- The methodology described is beyond reach of many investors, and would be costly (via fees) if delegated to a manager.