Which firm accounting measures best predict future stock returns? In the August 2014 version of their paper entitled “Are Cash Flows Better Stock Return Predictors than Profits?”, Stephen Foerster, John Tsagarelis and Grant Wang investigate the power of enhanced cash flow measures to predict stock returns. They first devise procedures for transforming indirect cash flow and income statements into estimates of cash flow directly available to stockholders (see the table below). They then compare the ability of these measures and of alternative cash flow/profit/income measures to predict stock returns via hedge portfolios that are each month long (short) the tenth of stocks with the best (worst) values of each measure. They scale all measures either by total assets or by market value of equity. They consider both value-weighted and equal-weighted hedge portfolios. They use the real-time S&P 1500 (excluding financial firms) as their stock universe to ensure investability. Using monthly accounting data lagged by four months and monthly stock returns for the specified set of firms during October 1994 through December 2013, they find that:
- Over the entire sample period, direct cash flow measures generally outperform indirect cash flow, operating profit, gross profit and net income as stock return predictors. Specifically:
- The annualized gross returns for hedge portfolios based on direct cash flow measures range as high as 10%, materially higher than those for other measures.
- Gross information ratios (annualized returns divided by annualized standard deviations) are generally higher for hedge portfolios based on direct cash flow measures than on other measures (see the chart below).
- Findings are generally robust to different portfolio reformation intervals, to adjustment for commonly used risk factors (market, size, book-to-market ratio, momentum and liquidity) and across equity sectors. However, results are not very consistent across four short subperiods (22 to 89 months) defined by market conditions.
- Cash taxes and capital expenditures offer incremental predictive power.
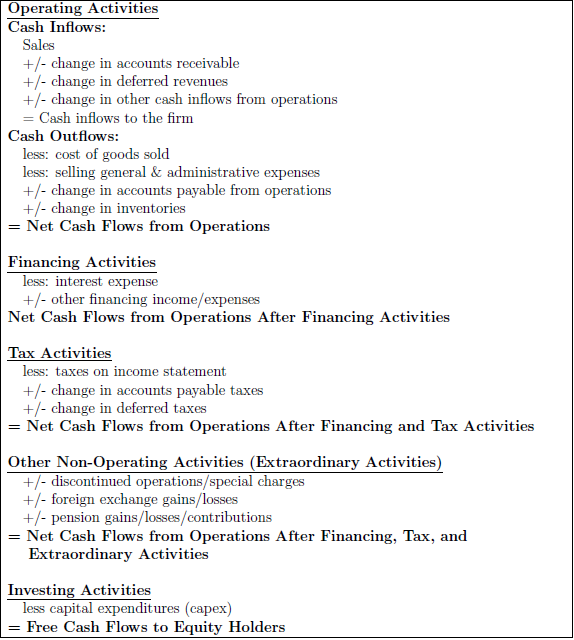
The following table, taken from the paper, explains how to extract approximate direct cash flows for operations, financing activities, taxes and other non-operating activities from firm income and indirect cash flow statements.
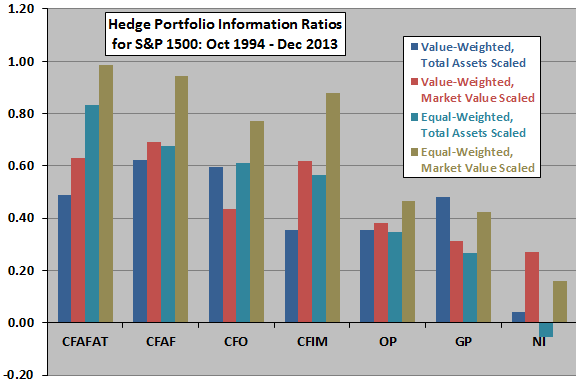
The following chart, constructed from data in the paper, compares gross information ratios for hedge portfolios reformed monthly that are long (short) the tenth of stocks with the best (worst) of seven accounting measures during October 1994 through December 2013. The information ratio is the annualized hedge portfolio return divided by the annualized standard deviation of returns. The seven accounting measures are:
- CFAFAT: net cash flow from operations after financing and tax activities minus capital expenditures.
- CFAF: net cash flow from operations after financing activities minus capital expenditures.
- CFO: net cash flow from operations minus capital expenditures.
- CFIM: operating activities net cash flow (indirect) minus capital expenditures.
- OP: operating profit (sales minus cost of goods sold and selling, general and administrative costs excluding research and development).
- GP: gross profit (sales minus cost of goods sold).
- NI: net income.
Portfolio holdings are either value-weighted or equal-weighted. Accounting measures are scaled either by total assets or market value.
Results indicate that cash flow measures are generally more informative about future stock returns than are operating profit, gross profit and net income.
In summary, recent evidence for an investable sample of U.S. stocks indicates that cash flow measures are generally better predictors of returns than operating profit, gross profit and net income.
Cautions regarding findings include:
- The sample period of just under 20 years is not long for the type of analyses performed in terms of business cycles and bull/bear markets. The subperiods are very short for such analyses.
- Reported performance data are gross, not net. Including trading frictions and shorting costs would reduce these returns, possibly to different degrees for different accounting measures.
- Shorting constraints may preclude some backtested short positions.
- Testing many different indicators on the same set of data introduces data snooping bias, such that the best result likely includes luck and overstates expected performance.
See also “40-Year Valuation Ratio Horse Race” and “Gross Profitability as a Stock Return Predictor”.