Both stock price momentum and asset growth rate exhibit empirical value as return predictors for individual stocks. Does combining these indicators offer enhanced value to investors? In their September 2010 paper entitled “Firm Expansion and Stock Price Momentum”, Peter Nyberg and Salla Pöyry investigate the interaction between firm-level asset growth (change in balance sheet total assets) and stock price momentum. Specifically, they measure returns for a monthly strategy that buys (sells) the prior winners (losers) within groups of stocks sorted first on on asset growth rates and then on 11-month past returns with skip-month. Using data for a broad sample of U.S. firms listed on NYSE, AMEX and NASDAQ over the period 1964-2006, they find that:
- Profits for hedged momentum strategies (long winners and short losers) concentrate within firms with large past asset expansions or contractions (see the chart below). Equally weighted portfolios with the highest / close to zero /lowest lagged asset growth rates generate average monthly hedged momentum strategy returns of 1.52% / 0.26% / 1.03%, respectively.
- This relationship between change in assets and momentum significantly persists after controlling for market capitalization, book-to-market ratio, share turnover, stock return volatility and credit rating. It also persists during recessions, after periods of negative lagged stock market returns and after periods of low investor sentiment.
- The firm-level relationship translates to a positive relationship between aggregate corporate asset growth rate and hedged momentum strategy performance. Subperiods characterized by exceptionally high (low) aggregate asset growth rates correspond to monthly hedged momentum strategy profitability of about 1.74% (0.18%).
- In some respects, lagged asset growth explains momentum returns better than past returns.
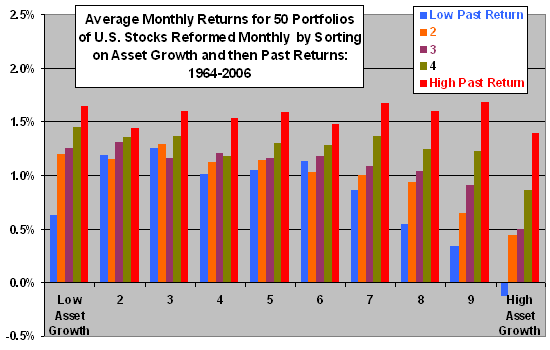
The following chart, constructed from data in the paper, summarizes average monthly returns for 50 equally weighted portfolios reformed monthly based on sorting first into ten groups by total asset growth rate the prior year and then into five subgroups by stock returns over the past 11 months (with skip-month) over the entire 1964-2006 sample period. Notable results are:
- High (very positive) asset growth rates enhance hedged momentum strategy returns more strongly than very low (negative) asset growth rates.
- Asset growth rate is not a future return discriminator among stocks with high past returns (asset growth rate does not enhance a long-only momentum strategy).

Note that all return calculations in this study assume frictionless portfolio formation.
In summary, investors employing stock-level hedged (but not long-only) momentum strategies may be able to enhance returns by focusing on companies with high total asset growth rates the prior year.