Is Robert Shiller’s cyclically adjusted price-to-earnings ratio (CAPE or P/E10) a better predictor of long-term stock market performance than other valuation ratios? In his January 2016 paper entitled “Predicting Stock Market Returns Using the Shiller CAPE — An Improvement Towards Traditional Value Indicators?”, Norbert Keimling first examines whether reduced dividend payout, new accounting standards and structural changes to key stock indexes limit the comparability of current and historical CAPEs. He then investigates whether CAPE is better at forecasting long-term equity market returns than price-to-earnings ratio, price-to-cash flow ratio, price-to-book ratio, dividend yield and CAPE adjusted for payout. Based on these findings, he applies CAPE and price-to-book ratio to predict long-term total returns for 17 equity markets in local currencies. Using Shiller’s monthly data for the U.S. stock market since 1871 and monthly data for 16 other country stock market indexes since 1969, all through 2015, he finds that:
- Regarding secular trend effects on CAPE forecasting accuracy:
- During 1881‐1950 (since 1990), S&P 500 firms distribute 66% (39%) of earnings as
dividends, with firm profits growing 1.0% (2.7%) annually. However, adjusting CAPE for dividend payout does not improve forecast accuracy. - U.S. accounting policies and practices become increasingly conservative over time, such that earnings used to calculate CAPE may increasingly underestimate actual earnings potential. It is almost impossible to assess the effect of accounting changes on CAPE forecast accuracy.
- CAPE forecast accuracy diminishes with increasing market index structural change (such as declining number of stocks in the index or a shift in industry concentration).
- During 1881‐1950 (since 1990), S&P 500 firms distribute 66% (39%) of earnings as
- Regarding CAPE conditions and forecasting value:
- Average historical CAPEs vary considerably across country stock indexes, from 14.8 for the Netherlands to 43.2 for Japan.
- The S&P 500 Index and the aggregated other country markets have an average CAPE just
over 20 during 1979‐2015, an “overvaluation” of about 30% relative to the S&P 500 Index average CAPE of 16.6 since 1881. - Across all countries, a CAPE below 10 (above 30) is followed by average annual growth of 11.7% (0.5%) over the next 10 to 15 years.
- Intermediate-term maximum drawdowns increase with CAPE (but still may be onerous even for low CAPE). The worst drawdown within three years after a CAPE below 10 (above 30) is ‐51% (-77%).
- Comparing other valuation ratios to CAPE:
- Price-to-book ratio and CAPE adjusted for payout are similar to CAPE in accuracy of long-term stock market forecasts. Average real return over the next 10 to 15 years is 13.3% after the lowest tenth of monthly CAPE values across all 17 markets, compared to 13.6% and 12.5% after the lowest tenths of values of price-to-book ratio and CAPE adjusted for payout, respectively. Average maximum drawdowns after high and low valuations are also comparable.
- In countries with structural breaks in index composition, price-to-book ratio exhibits some advantage over CAPE.
- Price‐to‐earnings ratio, price‐to‐cash‐flow ratio and dividend yield are generally inferior to CAPE in forecasting long-term returns.
- Based on end-of-2015 CAPEs and price-to-book ratios, expected real annual returns over the next 10-15 years are:
- 6.3% for a global equity portfolio.
- 4.5%, 7.4% and 8.9% for European, emerging and U.S. markets, respectively.
- 10.2%, 9.9% and 9.8% for Singapore, Italy and Norway, respectively.
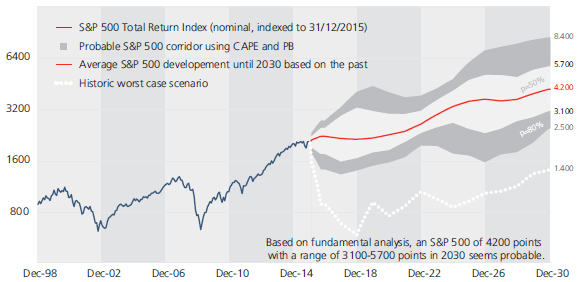
- Analysis of scenarios for the S&P 500 Index based on returns of the last few decades and end-of-2015 valuation ratios suggests (see the chart below):
- A probable range of 3100 to 5700 points in 2030.
- A reasonably conceivable range of 1300 to 4100 over the next three years.
The following chart, taken from the paper, summarizes performance ranges for the S&P 500 Index over the next 15 years based on those exhibited historically by equity markets with comparable valuations (CAPE 25.9 and price-to-book ratio 2.8 at the end of 2015). For reference, the chart also shows the inflation-adjusted S&P 500 Index since December 1998. Assuming 1% inflation and reinvestment of dividends, historical variability suggests:
- An expected S&P 500 Index level in 2030 of 4200.
- A 50% likelihood of a level between 3100 and 5700 in 2030.
- An 80% likelihood of a level between 2500 and 8400 in 2030.
- After removing outliers (upper and lower 10% of observations), a range of 1300-4100 over the next three years.
- A worst known case (back to 1881) of a crash to 600 over the next three years. The best known case (not shown) is 6900 over the next three years.

In summary, evidence suggests that CAPE and price-to-book ratio are among the best stock index valuation ratios for forecasting long-term future returns.
Cautions regarding findings include:
- The sample period since 1979 is very short in terms of independent 10-year CAPE measurement and forecasted long-term return intervals.
- Scatter plots in the paper imply far more robust samples than supported by interrelatedness of returns across countries (correlations) and within countries (autocorrelations).
- The large swings in explanatory power of CAPE for future returns after excluding specific countries emphasize fragility of findings, as does the large range of outcomes for the S&P 500 Index scenarios.
- Analyses are in-sample. An investor operating in real-time over the available sample periods may not have been able to exploit findings (see the real-time analyses in “Usefulness of P/E10 as Stock Market Return Predictor”).
- Testing forecasting abilities of multiple variables on the same data introduces snooping bias, thereby overstating forecasting accuracies of the best-performing variables.