Is company financial leverage a useful indicator of future stock returns? In their October 2010 paper entitled “Would You Follow MM or a Profitable Trading Strategy?”, Brian Baturevich and Gulnur Muradoglu test company leverage (gearing ratio) as a predictor of stock outperformance, controlling for market capitalization, price-to-earnings ratio, market-to-book value ratio and beta. At the beginning of May each year, they construct ten equally weighted portfolios ranked on gearing ratio as of the end of the preceding December and hold the portfolios for three years. They further sort each of these portfolios into ten sub-portfolios ranked on controlling variables as of the end of the preceding December (creating 100 sub-portfolios). Using stock return and accounting data for 413 non-financial S&P 500 companies over the period May 1985 through April 2004, they find that:
- The average gearing ratios for the ten portfolios ranked by leverage over the entire sample period ranges from 1.2% for decile 1 to 69.4% for decile 10.
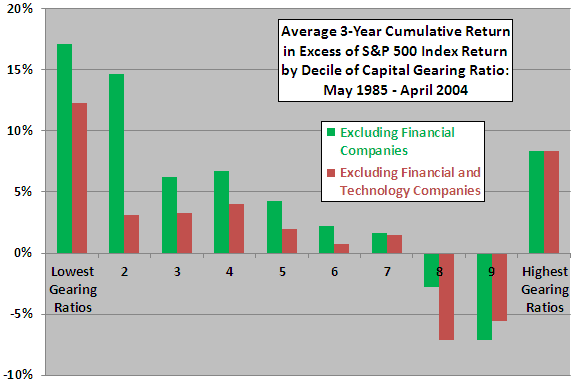
- Stocks in the lowest gearing ratio decile exhibit the strongest outperformance, beating the S&P 500 Index by an average cumulative 17% over the three-year holding period (see the chart below).
- Market capitalization has a substantial effect on results, but the other three control variables do not:
- Stocks in market capitalization decile 1 beat the S&P 500 Index by an average 50.1% over the sample period. The sub-portfolios formed from gearing ratio deciles 1 and 2 and market capitalization decile 1 are 82.3% and 86.7%, respectively.
- There may be a weak argument for a strategy based on low gearing ratio and low price-to-earnings ratio, but results for this combination exhibit extremely high variability.
- Evidence in support of a strategy based on low gearing ratio and low market-to-book value ratio is weak.
- Evidence in support of a strategy based on low gearing ratio and extreme values of beta is inconsistent.
The following chart, constructed from data in the paper, shows average 3-year cumulative returns relative to the S&P Index by gearing ratio decile over the entire sample period for all S&P 500 companies except financial companies and for all except financial and technology companies. Results suggest a negative relationship between gearing ratio and performance, but the lack of completely systematic progressions undermines confidence in the reliability of the relationship and complicates consideration of hedge portfolios.
The relatively strong performance of stocks with the highest capital gearing ratios derives substantially from small companies. Results for large-capitalization stocks (upper third) are so unsystematic that one might conclude that smaller companies drive any relationship.

The “MM” in the title of the paper refers to the “seminal work of Modigliani and Miller (1958) on capital structure,” which hypothesizes that the “expected rate of return…on the stock of any company…is a linear function of leverage.”
Note that:
- The sample of 413 companies is small for some of the analyses performed, especially for assessment of controlling variables via formation of 100 sub-portfolios. The number of stocks in these sub-portfolios is extremely small for inference.
- Also the sample period (only 6+ independent three-year intervals) is short for the method used, and the disinflationary trend during this sample period may be relevant to results.
- In general, assumptions used in statistical significance tests seem arguable.
In summary, investors may be able to exploit the outperformance of stocks in small to mid-size companies with low gearing ratios (low leverage). In other words, small firms with room to borrow may be the best bets.
Results from extending the study sample period to include more recent data would be interesting.