Does a surge in patent activity predict a surge in, or creative destruction of, equity value? To explore this question, assuming patent applications need not be approved to be exploited, we examine relationships between the growth rates of U.S. patent applications/patents as simple measures of innovation and U.S. stock market returns. Using U.S. patent activity (numbers of applications and patents) by calendar year and annual levels of Shiller’s S&P Composite Index during 1871 through 2015 (142 years), we find that:
Per the U.S. Patent and Trademark Office, there are three types of patents:
- “Utility Patent – Issued for the invention of a new and useful process, machine, manufacture, or composition of matter, or a new and useful improvement thereof…”
- “Design Patent – Issued for a new, original, and ornamental design embodied in or applied to an article of manufacture…”
- “Plant Patent – Issued for a new and distinct, invented or discovered asexually reproduced plant including cultivated sports, mutants, hybrids, and newly found seedlings, other than a tuber propagated plant or a plant found in an uncultivated state…”
We consider only utility and design patent applications and patents.
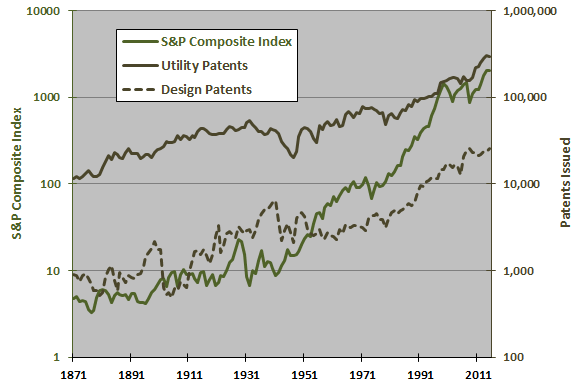
The following graph compares annual levels of the S&P Composite Index and annual numbers of utility and design patents issued (logarithmic scales) over the sample period. All series trend upward, stocks more steeply than patents, but visual inspection exposes no other relationship.
For greater precision, we relate annual changes.
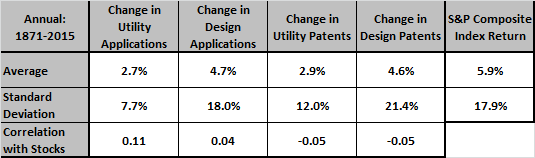
The following table compares the average annual changes and standard deviations of annual changes for various patent activities and the S&P Composite Index over the sample period. It also shows same-year Pearson correlations between changes in patent activities and stock index returns. Patent activities have on average grown more slowly than the stock market, with lower or comparable volatilities. Correlations are small, indicating R-squared statistics of 0.01 or less and therefore explanatory powers of 1% or less between patent activities and contemporaneous stock market returns.
Might changes in patent activities lead or lag stock market returns?
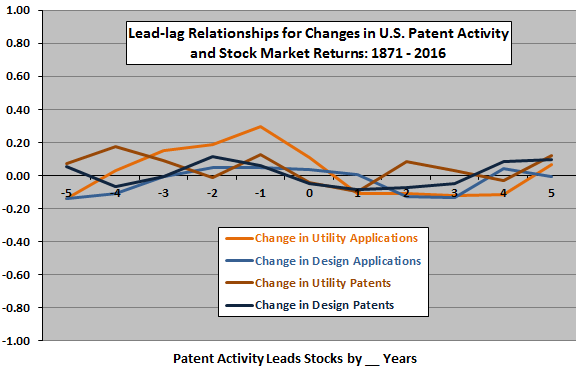
The next chart shows the Pearson correlations for various lead-lag relationships between annual changes in patent activities and annual S&P Composite Index returns, ranging from the stock market leads patent activities by five years (-5) to patent activities lead the stock market by five years (5) over the sample period. Results suggest that:
- Lead-lag relationships with stock market returns are more systematic for applications than patents.
- While correlations are mostly small, the stock market tends to lead patent activities positively by one to three years, and patent activities tend to lead the stock market negatively by one to three years.
It may be that more (less) funding is available for research and development when the stock market is strong (weak). It may also be that marginal research and development tends to destroy some market value as product/service obsolescence temporarily outpaces innovation, or that marginal research and development is largely wasted.
Are results consistent for a recent subperiod?
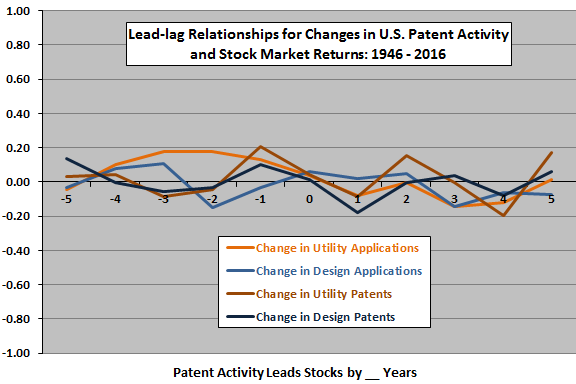
The next chart repeats the above lead-lag test for annual data after 1945. Results for this subsample appear to be mostly noise, except perhaps for the relationship between change in utility applications and stock market returns.
In case there are important non-linearities, we look at average stock market return by range of changes in patent activities.
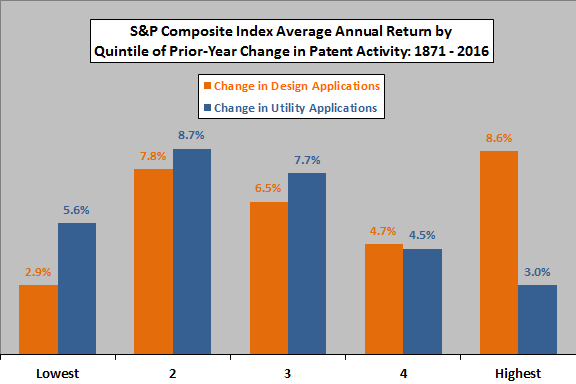
The final chart shows average annual S&P Composite Index return by ranked fifth (quintile) of prior-year changes in design patent applications and utility patent applications over the entire sample period (27-29 observations per quintile).
Results are inconsistent between patent application types, and neither series approximates a progression across quintiles. Nor do standard deviations of returns (not shown) vary systematically across quintiles for either series.
In summary, evidence from simple tests suggest that relatively strong (weak) growth in utility patent applications may indicate stock market weakness (strength) the next few years, but any such tendency appears too weak to exploit.
Cautions regarding findings include:
- Analyses are generally in-sample. The in-sample relationships are not strong enough or immediate enough to motivate out-of-sample testing.
- Considering different measures of aggregate technological innovation and different lead-lag relationship intervals introduces some data snooping bias into correlations, such that the strongest correlations overstate expectations.
- Stock market returns are capital gains only (excluding dividends).