In his May 2002 paper entitled “Market Timing Strategies that Worked”, Pu Shen evaluates the effectiveness of the spreads between the S&P 500 index earnings yield (the earnings/price ratio or E/P) and the yields on 10-year Treasury notes (T-note) and 3-month Treasury bills (T-bill) as market timing indicators. By constructing “horse races” between switching strategies that call for investing in the stock market index unless spreads are lower than predefined thresholds during 1970-2000, he concludes that:
- When the market is dominated by overly optimistic (pessimistic) sentiment, the S&P 500 earnings yield is more likely to be extremely low (high) relative to yields of alternative investments.
- The frequencies of negative monthly returns in the S&P 500 index are significantly higher when spreads between the S&P 500 earnings yield and the yields of Treasury instruments at the end of the prior month were extremely low. S&P 500 index monthly returns average 1.5% for the 300 months when spreads were not particularly low. Monthly returns average -0.4% for the 72 low-spread months. Also, the stock market tends to be more volatile in low-spread months.
- Using the spread between the S&P 500 earnings yield and either the T-bill yield or the T-note yield as a timing signal outperforms buy-and-hold on a risk-adjusted basis (higher Sharpe ratio). The T-bill strategy beats the T-note strategy.
- Timing strategies based only on either the T-bill or the T-note yields also beats buy-and-hold, but almost all of the outperformance from these simple signals comes during the high-inflation period of the 1970s. A timing strategy based only on the S&P 500 earnings yield does not beat buy-and-hold.
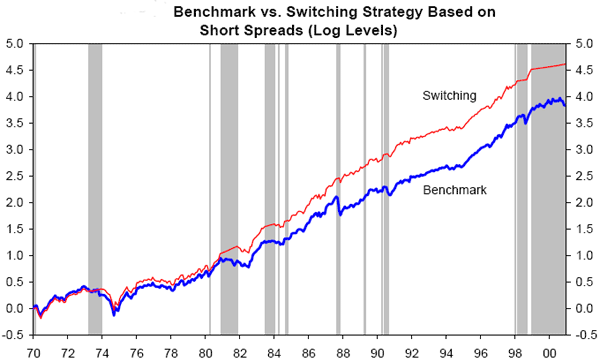
The following chart, taken from the paper, illustrates the outperformance of switching in and out of the stock market based on the short spread (between the S&P 500 Index earnings yield and the T-bill yield) over a benchmark buy-and-hold approach. Shaded areas indicate periods during which the short spread is below its 10th percentile value.

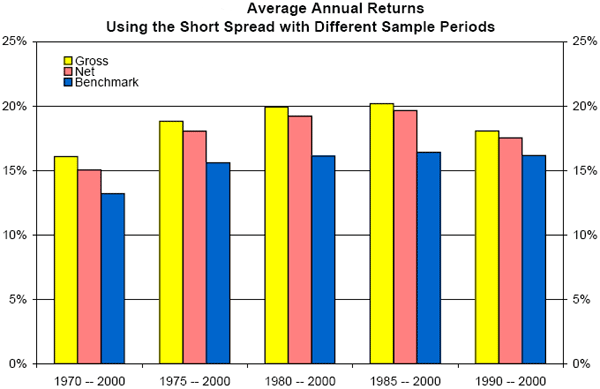
The next chart, also from the paper, shows the consistent outperformance of the short spread switching strategy over the benchmark buy-and-hold approach over various time frames between 1970 and 2000. The “Net” returns for the switching strategy debit the “Gross” returns to account for transaction costs.

In summary, the gap between the S&P 500 earnings yield and Treasury instrument yields has some market timing value, with short spreads outperforming long spreads.