Is fundamental valuation of stocks an inherently effective investment approach? In their October 2015 paper entitled “Fundamental Analysis Works”, Sohnke Bartram and Mark Grinblatt test whether fundamental valuation usefully predict stock performance. Each month, they estimate the fair value (market capitalization) of each stock based on linear regression versus the 28 most commonly reported firm accounting variables (14 from the balance sheet and 14 from the income statement), thereby avoiding snooping of specific indicators. They then rank stocks into fifths (quintiles) based on the degree to which the market misprices them (percentage difference between actual market capitalization and estimated fair value). Finally, they measure the profitability of a monthly reformed portfolio that buys (sells) the most undervalued (overvalued) quintile. Using monthly accounting data as available from Forms 10-Q/10-K and prices for a broad sample of non-financial U.S. common stocks during January 1977 through December 2012 (432 months), they find that:
- A hedge portfolio that is long the equal-weighted (value-weighted) quintile of the most undervalued stocks and short the quintile of the most overvalued stocks, reformed monthly, generates an average gross monthly return of 0.68% (0.44%). The gross annualized return is 8.1% (5.3%). The gross return is positive in 61% (56%) of months.
- Compared to the most overvalued quintile, the most undervalued quintile consists of stocks with lower market capitalizations, lower past returns and higher book-to-market ratios. In other words, underpriced stocks tend to small value losers.
- Depending on the number of factors used for risk adjustment (three to seven), gross annualized alpha of the hedge portfolio is in the range 4% to 9% and positive during about 60% of months.
- Results are fairly consistent across subperiods.
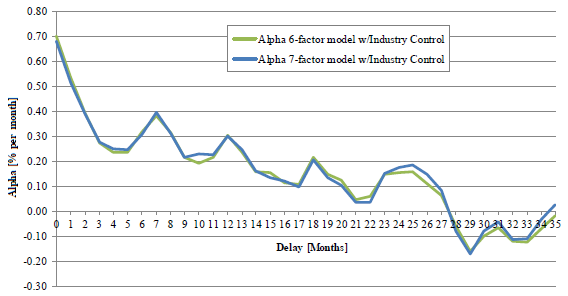
- The greatest rate of convergence to fair value of misvalued stocks occurs during the first month after valuation and decays to zero over the next 28 months (see the chart below).
- Annual rather than monthly portfolio reformation of an equal-weighted hedge portfolio reduces gross alpha by about half, but also cuts annual portfolio turnover from 226% to 59%.
- Using initially reported (rather than as-revised) accounting data reduces gross monthly alpha by about 0.09%.
The following chart, taken from the paper, tracks average gross monthly six-factor (market, size, book-to-market, momentum, short-term reversal, long-term reversion) and seven-factor (adding profitability) alphas for the hedge portfolio specified above over the 35 months after formation. The two alphas exhibit similar decay behaviors. Accrual of alpha is rapid during the first three months (especially the first month). Stocks reach initial fair value estimates after about 2.3 years.

In summary, evidence indicates that stock valuation based on comprehensive accounting data does segregate stocks according to actual fair value.
Cautions regarding findings include:
- The word “works” in the paper’s title means gross, not net. Monthly rebalancing frictions and shorting costs would reduce hedge portfolio performance. Moreover, shorting of overvalued stocks may not always be feasible (shares may be unavailable for borrowing).
- Nor do findings include costs of monthly data collection/processing. Investors delegating such efforts would incur management fees.
- As noted, principal findings incorporate accounting revisions retroactively, thereby overstating hedge portfolio profitability.
- As noted in the paper, more precise ways of estimating fair values may exist. However, snooping of alternatives would impound bias.