Is the relationship between Cyclically Adjusted Price to Earnings Ratio (CAPE, or P/E10) and future long-term stock market returns evidence of market inefficiency? In other words, can investors exploit P/E10 to beat the market? In their November 2016 paper entitled “Shiller’s CAPE: Market Timing and Risk”, Valentin Dimitrov and Prem Jain examine whether investors with a 10-year investment horizon can beat the market by holding either the S&P 500 Index or 10-year U.S. Treasury notes (T-notes) as a low-risk alternative according to whether P/E10 is low or high. Their methodology is comparison of averages and volatilities (standard deviations) of future 10-year nominal total returns by ranked tenth (decile) of monthly P/E10. They assume reinvestment of dividends and interest at a monthly frequency. Using monthly values of P/E10, stock market total returns (including dividends) and T-note yields from Robert Shiller’s database during January 1871 through August 2016, they find that:
- For the S&P 500 Index over the full sample period:
- Average 10-year nominal total return is 168%, with standard deviation 128%.
- Maximum (minimum) 10-year total return is 581% (-33%) during July 1949 through June 1959 (September 1929 through August 1939).
- There is a non-linear inverse relationship between P/E10 and future returns. For the decile of observations with the lowest (highest) values of P/E10, average future 10-year total return is 270% (58%).
- For T-notes over the full ample period, average 10-year nominal total return is 63%, with standard deviation 45%. The overall relationship between P/E10 and future 10-year total returns is not strong. Returns are highest after the two lowest and one highest deciles of P/E10.
- For the first nine deciles of P/E10, average future 10-year total returns are higher for the S&P 500 Index than for T-notes (see the chart below). Specifically:
- For the ninth (second highest) decile of P/E10, average future 10-year total returns are 83% for the stock index versus 54% for T-notes.
- For the tenth (highest) decile of P/E10, average future 10-year total returns are are 58% for the stock index versus 64% for T-notes.
- Market timing is beneficial only when P/E10 is in the upper half of its tenth decile (higher than 27.6).
- P/E10 relates positively to volatility of future 10-year S&P 500 Index total returns, so reward-for-risk is a potential explanation for the negative relationship between P/E10 and future stock market return. Specifically:
- For the lowest (highest) decile of P/E10, the standard deviation of future 10-year S&P 500 Index total returns is 137% (54%).
- For the three lowest (three highest) P/E10 deciles, average standard deviation of future 10-year S&P 500 Index total returns is 115% (56%).
- Based on the full-sample relationship and current (end of September 2016) P/E10 value of 27.04, expected 10-year nominal S&P 500 Index (T-note) total return is 42% (17%). The stock market therefore does not appear expensive compared to T-notes.
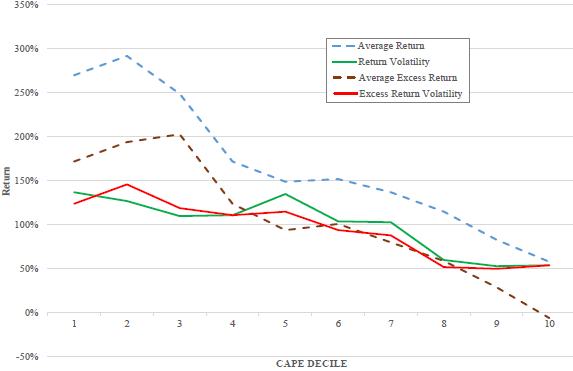
The following chart, taken from the paper, summarizes the following statistics across P/E10 deciles over the full sample period:
- Average future 10-year S&P 500 Index total return.
- Standard deviation of future 10-year S&P 500 Index total returns.
- Average future excess 10-year total S&P 500 Index returns (in excess of T-note returns).
- Standard deviation of future excess 10-year S&P 500 Index total returns.
Results indicate that:
- P/E10 relates negatively to average future 10-year S&P 500 Index total return.
- Average future 10-year S&P 500 Index excess total returns are positive for all P/E10 deciles except the highest, and are only marginally negative for the highest. In other words, T-notes hardly ever beat the stock index.
- P/E10 relates positively to volatility of future 10-year S&P 500 Index total returns and excess total returns.
In summary, evidence indicates that P/E10 is not useful for timing the S&P 500 Index, because the index almost always outperforms the risk-free asset (even when expected index returns are low).
Cautions regarding findings include:
- The sample is not large in terms of number of independent 10-year intervals (about 15), limiting confidence in findings. As noted in the paper, monthly calculations of 10-year statistics introduce severe measurement interval overlap, thereby distorting simple statistics.
- Analyses are entirely in-sample (employing P/E10 values and returns/yields for the full sample). Investors operating in real time would not have all these data and would have identified different decile breakpoints at different times. In other words, the methodology assumes “perfect foresight” and is not representative of realistic investor experiences.
- Although the return measurement interval is 10 years, P/E10 signals may occur at shorter intervals. An investor holding T-notes therefore bears risk of substantial capital loss due to changes in prevailing interest rates, arguing against using T-notes as the risk-free asset rather than some shorter-term instrument.
- As noted in the paper, extreme values of P/E10 concentrate during the 1920s and the 1990s and may not be representative of any general relationship between P/E10 and future stock market returns.
- The methodology does not account for the lag in availability of new earnings data compared to availability of stock market returns.
- Shiller’s monthly stock market levels are averages of daily levels, blurring monthly calculations. Use of 10-year measurement intervals mitigates this blurriness.
For an out-of-sample approach using a more conservative risk-free yield, see “Usefulness of P/E10 as Stock Market Return Predictor”.