A subscriber, citing the weekly record of S&P 500 earnings growth estimates in the “FactSet Earnings Insight” historical series, wondered whether estimate trends/revisions are exploitable. To investigate, we collect S&P 500 quarterly year-over-year earnings growth estimates as recorded in this series. These data are bottom-up (firm by firm) aggregates, whether purely from analyst estimates (before any actual earnings releases), or a blend of actual earnings and estimates (during the relevant earnings season). Using these data and contemporaneous weekly levels of the S&P 500 Index during April 2011 through June 2020, we find that:
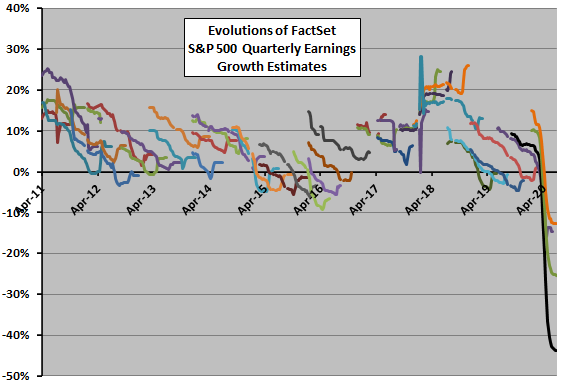
The following chart tracks evolutions of FactSet S&P 500 earnings growth estimates for each quarterly earnings cycle in the sample. Data available vary by cycle, with histories of different lengths and some cycles missing one or a few weeks. Each cycle ends about three months after the quarter reported.
There is frequently a hook pattern in the cycles (long decline followed by a shorter recovery). There are apparently errors in two early 2018 reports, but we have not excluded them. The last three cycles, which materially affect findings from prior iterations of this analysis, reflect sharp earnings forecast reductions due to COVID-19 disruptions.
What are the average cyclic weekly earnings growth estimate changes?
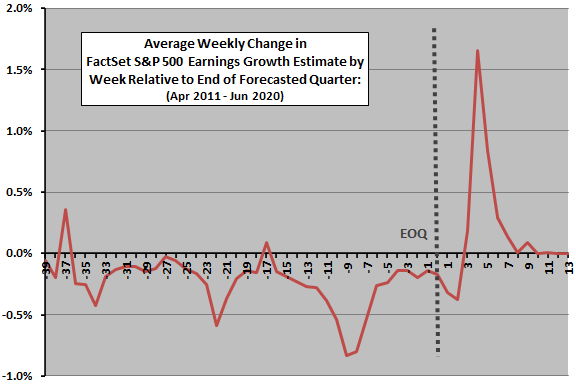
The next chart summarizes average weekly FactSet earnings growth estimate changes across a cycle that starts 39 weeks before the end of the quarter reported (EOQ) and ends 13 weeks after EOQ. Before EOQ, contributions to the aggregate are estimates. After EOQ, actual earnings replace estimates as released. For this analysis, when a weekly report is missing, we assume that the estimate for the missing week is the same as the prior week to ensure we capture all changes as would a user of these estimates.
Results confirm a conventional wisdom that:
- Analysts tend to begin an estimation cycle optimistically.
- Analysts tend to lower their estimates gradually but persistently over the next nine months.
- This dynamic creates an environment in which actual earnings beat final estimates.
The overall average weekly change in estimated earnings over this cycle (including the big positive “surprise” spike from actual earnings) is -0.13% per week.
How do weekly average changes compound?
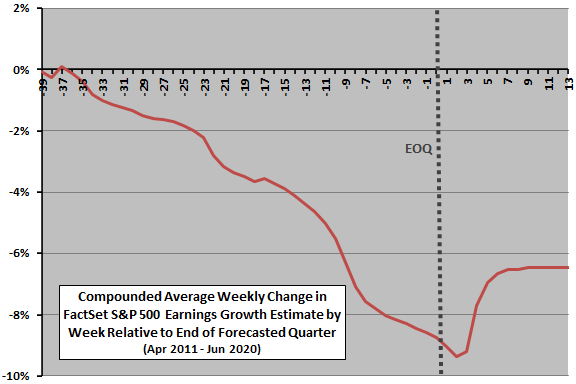
The next chart shows compounded average weekly FactSet S&P 500 earnings growth estimate changes across a quarterly cycle from 39 weeks before to 13 weeks after EOQ for the full sample. Notable points are:
- On average, about 9% of initial S&P 500 earnings growth estimates disappear before actual earnings releases.
- Positive earnings “surprises” recover about 2% of the “lost” growth rate. For example, if the initial earnings growth estimate is 10%, the typical fade reduces the estimate to about 1% before any actual earnings releases and then recovers to about 3% after all earnings releases.
- The initial estimate is therefore on average high by about 7%.
Can traders exploit weekly changes in earnings growth estimates?
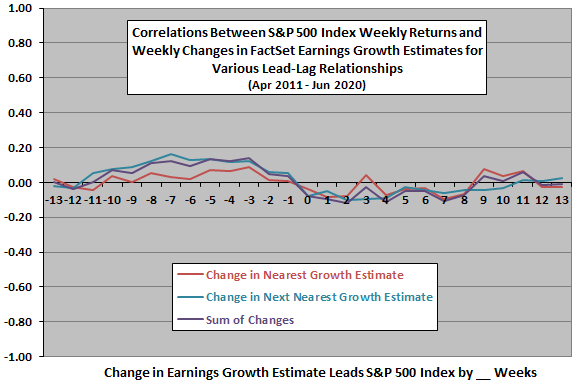
The next chart summarizes lead-lag relationships between weekly S&P 500 Index returns and weekly changes in three series of FactSet earnings growth estimate changes:
- Change in Nearest Growth Estimate – weekly change in earnings growth estimate for the current quarter up to eight weeks after the end of the reported quarter (by which time actual earnings are largely known).
- Change in Next Nearest Growth Estimate – weekly change in earnings growth estimate for the quarter after the current quarter.
- Sum of Changes – the simple sum of the preceding two changes.
Lead-lag relationships range from weekly S&P 500 Index return leads weekly change in earnings growth estimate by 13 weeks (-13) to weekly change in earnings growth estimate leads index return by 13 weeks (13).
Results suggest:
- A weak and diffuse tendency for stock market returns to lead changes in earnings growth estimates positively by one to 10 weeks. In other words, relatively strong (weak) stock market returns indicate relatively good (bad) future revisions in earnings growth estimates.
- A weaker and diffuse tendency for changes in earnings growth estimates to lead the stock market returns negatively by zero to eight weeks. In other words, relatively good (bad) changes in earnings growth estimates indicate a relatively weak (strong) future stock market returns.
To check for non-linearities in the relationship, we look at average next-week S&P 500 Index return by range of weekly changes in estimated earnings growth rate.
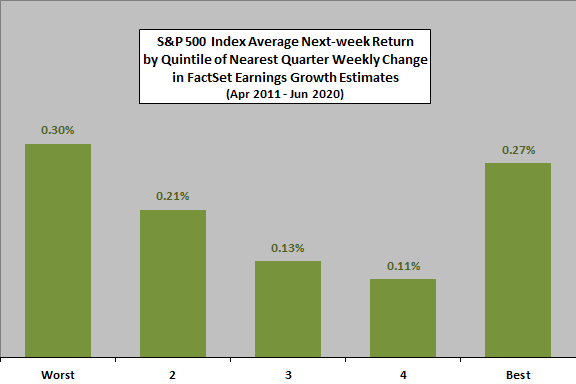
The final chart summarizes average S&P 500 Index next-week returns by ranked fifth (quintile) of weekly changes in earnings growth estimates for the nearest quarter as defined above. For this analysis, if there is no report for a week, we ignore that week. There are 88-89 observations per quintile. Average weekly return for all weeks during the sample period is 0.19%.
Results suggest tendencies for stock market returns to be strongest after very good and very bad weekly changes in earnings estimates.
Given the variability in weekly returns, the sample is small for this kind of analysis. In other words, excluding a single worst or best weekly return from a quintile substantially changes the average return for that quintile.
In summary, evidence from the available “FactSet Earnings Insight” historical series suggests that: (1) quarterly earnings growth estimate evolutions typically have a hook shape; and, (2) bad aggregate earnings growth estimate news may be better for the stock market than good news.
Cautions regarding findings include:
- The sample is short in terms of number of economic/market cycles (part of one bull market only). In other words, the sample may not be representative of other market states, as indicated by the material effect on finding of the last three earnings cycles (affected by COVID-19 disruptions) in the sample.
- The sample is small in terms of number of estimates/actuals cycles (only about 38 full cycles).
- As noted, the number of future quarters reported varies over time. Some weekly data are missing (no reports for some weeks or data not mentioned in a few reports). There are also apparently errors in a few reports.
See also from some years ago “Quarterly Aggregate Earnings Estimate Evolutions”, which tracks evolutions of Standard and Poor’s estimates of S&P 500 earnings growth during the 2008-2009 financial crisis.