Can investors rely on overvaluation signals from the market price-earnings ratio (P/E) and the Fed Model to predict major stock market corrections? Which model works better? In their July 2013 paper entitled “Does the Bond-Stock Earning Yield Differential Model Predict Equity Market Corrections Better Than High P/E Models?”, Sebastien Lleo and William Ziemba test the power of eight bond-stock earnings yield differential model (BSEYD) variants and eight market P/E model variants to predict stock market corrections. They specify the bond yield for the BSEYD model as that of the 10-year U.S. Treasury note (T-note). They define a stock market correction as a decline of 10% or more within one year. They specify the 16 model variants based on: (1) either BSEYD, the natural logarithm of BSEYD, P/E or the natural logarithm of P/E; (2) either current year or rolling 10-year average stock market earnings; and, (3) either of two ways of calculating the threshold for extreme overvaluation. Both methods of setting the extreme overvaluation threshold for the 16 indicators are out-of-sample based on indicator average and standard deviation over a rolling one-year historical window. They measure success of model variants based on both the proportion of signals followed by corrections within two years and, conversely, the proportion of crashes preceded by signals within the past two years. Using daily S&P 500 Index levels, S&P 500 earnings data and daily T-note yields during 1962 through 2012, they find that:
- There are 18 corrections as defined above during the sample period, with average duration 285 days and average total decline 25%.
- The BSEYD (P/E) model variants have significant (some) power to predict U.S. stock market corrections.
- BSEYD model variants offer more information about future stock market corrections than P/E model variants.
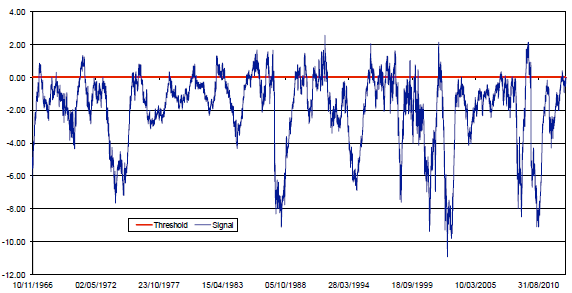
The following chart, taken from the paper, illustrates the signals generated by the BSEYD model variant that uses current year S&P 500 earnings and a normalized dynamic threshold (red line) set to capture the highest 5% of S&P 500 Index BSEYD values over the past year. The paper measures the power of extreme overvaluation signals (blue line above red line) to predict S&P 500 Index corrections of at least 10% as confirmed within two years after the signals.
In summary, evidence suggests that Fed Model-like overvaluation signals are somewhat more effective than market P/E overvaluation signals in anticipating large U.S. stock market declines.
Cautions regarding findings include:
- The study involves data snooping bias via consideration of 16 model variants, with the best-performing variants incorporating some luck. The small number of crashes exacerbates this bias.
- There is also potential for data snooping bias in selection of: (1) threshold values that define extreme overvaluation; (2) the length of the historical interval used to calculate overvaluation thresholds; and, (3) the length of the interval used to associate signals and subsequent crashes.
- The success criteria do not measure the performance of any trading system (exiting stocks before corrections and re-entering after). It is not obvious that the signals support any attractive trading system.