Can one calculate what the return from the overall stock market, or from a specific stock, should be? In the never-ending quest to achieve this goal, Hollister Sykes presents his recent “An Equity Market Model and Its Implications”. This model calculates investor return as a function of four variables: (1) earnings yield; (2) return on equity; (3) ratio of dividend payout to earnings; and, (4) ratio of share repurchases or sales value to earnings. Model details and implications, and the results of testing it with 133 years of aggregate market data, are as follows:
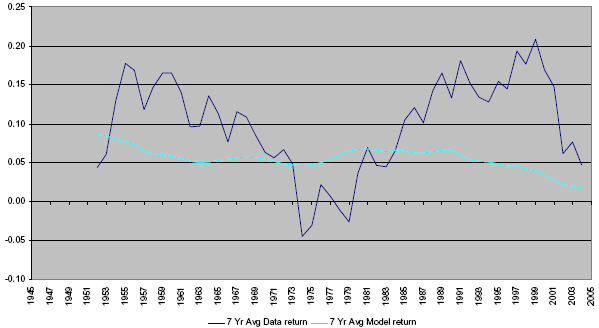
- The model calculates “core-value” return, ignoring speculative variation of the stock price during the year. Specifically, it uses only beginning-of-year values for the market value of equity and the total investment in equity assets. (See the first figure below to see the magnitude of speculative variation.)
- The model uses deflated dollars, taking into account the effects of inflation.
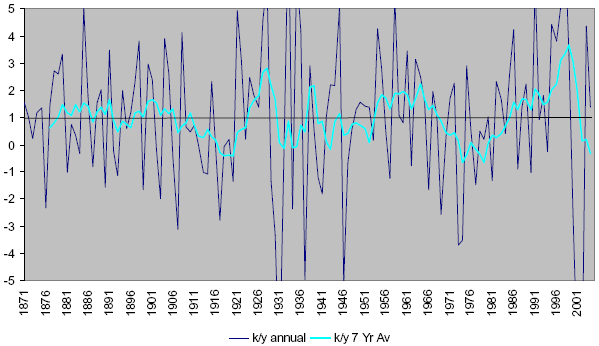
- At equilibrium, all three of investor return, earnings yield and return on equity should be equal. (See the second figure below to see the historical relationship between investor return and earnings yield.)
- The price/earnings ratio (P/E) is not a valid measure of relative value among stocks. Return on investment, not earnings, is the driver of investment return. In other words, return on investment determines the equilibrium P/E.
- There is no theoretical limit on the equilibrium P/E, but the long-term historical level of the risk-free rate suggests that aggregate stock market P/Es above 25 or 30 are untenable. A P/E of 25 would offer an equity risk premium of 3.4% over the long-term 90-day Treasury bill rate.
- Speculative variation remains a mystery. The historical productivity trend, which might establish expectations for future return on investment and therefore future investment returns, does not offer a convincing explanation of variation of P/E from equilibrium.
The following figure, taken from the paper, compares the rolling seven-year average returns calculated by the model (turquoise) with those from the historical record (dark blue) for 1945-2004. The author calls the gap between the two lines speculative variation. The core-value return calculated by the model has mostly trended downward over this period, while actual returns have varied widely and trended mostly upward.

The next figure, also taken from the paper, shows the annual value (dark blue) and the seven-year average value (turquoise) of the ratio of investor return to earnings yield for 1871-2004. It suggests that this ratio tends to revert to a value of 1, supporting the model’s theoretical conclusion that investor return equals the earnings yield at equilibrium.

In summary, investors should focus on return on investment as the driver of investment returns and earnings yield as the indicator of how large the returns should be.
The unexplained “speculative variation” in equity returns in this model is large in comparison to calculated changes in core-value returns. In other words, the model does not describe most of the equity price variations encountered in the real word, but it does offer a tether point for speculation.