A reader suggested that we evaluate the usefulness of ValueEngine, self-described as “a stock valuation and forecasting service founded by Ivy League finance academics” utilizing “the most advanced quantitative techniques and analysis available.” ValueEngine offers a limited archive (20 weeks) of their free weekly newsletter that includes a “Summary of VE Stock Universe” within a section entitled “ValueEngine’s Market Overview.” This summary states the percentages of stocks undervalued and overvalued and the percentages of stocks undervalued and overvalued by at least 20%. If these summaries are meaningful, the net levels of mispricing they indicate should be to some degree predictive of future stock market behavior. Using the weekly mispricing summaries for 5/11/07-6/20/08 (a total 58 summaries, with none listed for 1/25/08) and contemporaneous weekly S&P 500 index data, we find that:
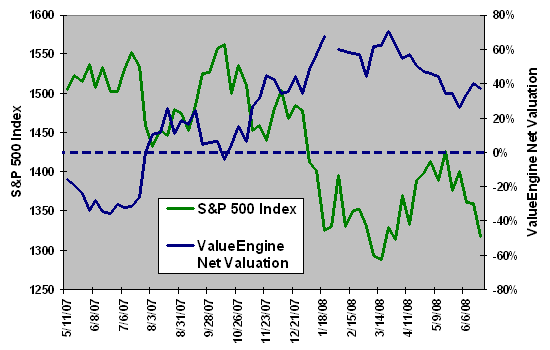
The following chart compares net market valuation (percentage of stocks undervalued minus percentage of stocks overvalued) from ValueEngine’s weekly newsletter with the behavior of the S&P 500 index over the entire sample period. The gap in net valuation corresponds to the missing 1/25/08 weekly newsletter. A positive (negative) net valuation suggests overall market undervaluation (overvaluation). For example, the ValueEngine net valuation suggests that the market was overvalued during May-July 2007, valued about right during August-October 2007 and generally undervalued since November 2007.
To test predictive power, we compare net valuation and future S&P 500 index returns.

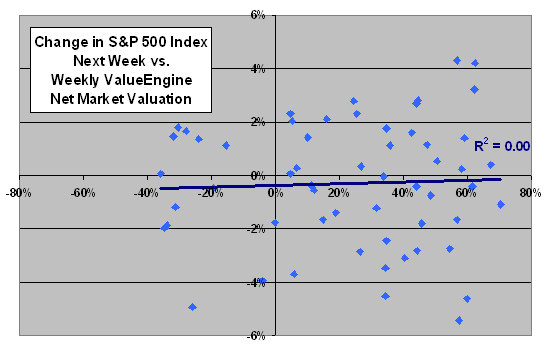
The following scatter plot relates ValueEngine’s weekly net valuation to the change in the S&P 500 index the next week over the entire sample period. The Pearson correlation for the two series is 0.04 and the R-squared statistic is 0.00, indicating no relationship between current net valuation and broad stock market behavior the next week.
Results are similar for ValueEngine’s weekly net extreme valuation (percentage of stocks undervalued by at least 20% minus percentage of stocks overvalued by at least 20%) to the change in the S&P 500 index the next week. The Pearson correlation for these two series is 0.03 and the R-squared statistic is 0.00, indicating no relationship between current net extreme valuation and broad stock market behavior the next week.
Depending on how ValueEngine calculates valuations, the number of independent observations in these samples may be very small.
Might ValueEngine’s net valuation show predictive power over a longer horizon?

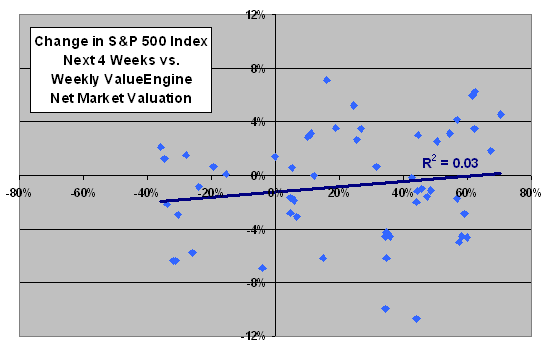
The next scatter plot relates ValueEngine’s weekly net valuation to the change in the S&P 500 index the next four weeks. The Pearson correlation for the two series is 0.06 and the R-squared statistic is 0.03, indicating that the net valuation may explain a few percent of the movement of the overall stock market over the next month.
The sample is very small, with no more than 13-14 independent observations (because of overlaps among four-week intervals), so confidence in this conclusion is very low.
Might the relationship be especially noticeable for some ranges of ValueEngine’s net valuation?

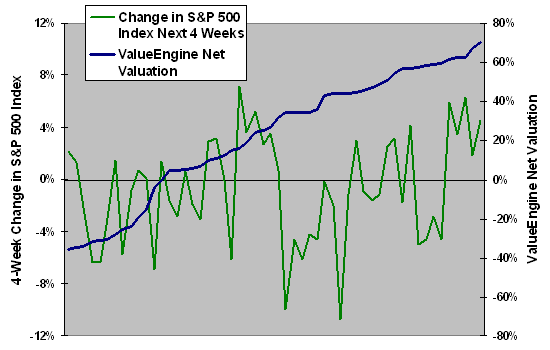
The final chart is an ordered scatter plot that arranges ValueEngine’s weekly net valuation from lowest value to highest value for the entire sample (the horizontal axis is not chronological) and relates it to the change in the S&P 500 index over the next four weeks. Especially given the small number of independent observations, evidence that any particular range of net valuation reliably predicts overall stock market returns over the next month is unconvincing.

The reactive Pearson correlations between ValueEngine’s weekly net valuation and the change in the S&P 500 index the prior week (prior four weeks) is -0.06 (-0.23), slightly stronger than the positive predictive correlations above. In other words, stock returns may predict net valuation better than net valuation predicts stock returns.
In summary, evidence from a small sample does not support a belief that ValueEngine’s market overview statistics meaningfully predict near-term behavior of the broad stock market.
Note that ValueEngine’s weekly counts are apparently equal-weighted, whereas the S&P 500 index is value-weighted. Net valuation readings from these counts might work better with some broad equally-weighted portfolio of stocks. Also, reversion to ValueEngine’s calculated value baseline might be more reliable for forecast intervals longer than four weeks, but the sample collected so far is much too small to test long intervals.