Does the market efficiently bound the mispricings of stocks within the costs of exploiting the mispricings? In their August 2008 paper entitled “Mispricing and Costly Arbitrage”, Ronnie Sadka and Anna Scherbina explore the difficulty of exploiting short-term mispricings of stocks derived from analyst disagreement about future earnings (with mispricing likely due to very pessimistic analysts withholding their views). Using stock price and earnings forecast data for a broad sample of stocks over the period January 1983 through August 2001, they conclude that:
- Stocks with high analyst disagreement about future earnings tend to be overpriced, with the degree of mispricing sensitive to overall stock market liquidity.
- Over the entire sample period, a hedge portfolio that is long (short) the 4% of stocks with the lowest (highest) levels of analyst disagreement, rebalanced monthly, produces a four-factor [market, size, book-to-market, momentum] alpha of 1.33% per month before trading costs. The short side of the portfolio generates most of the alpha (0.89%).
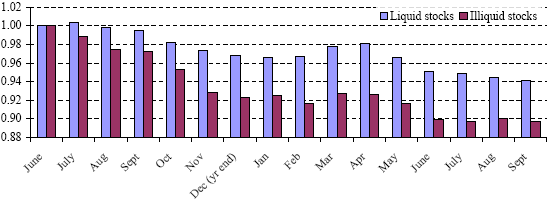
- However, the liquidity of individual stocks tends to decline as analyst disagreement increases. Trading costs therefore tend to be higher when mispricing is more pronounced, significantly reducing profits available from exploiting the mispricing. (See the chart below.)
The following chart, taken from the paper, shows average cumulative abnormal (four-factor) returns of two sets of stock portfolios formed each June during 1983-2001 and held for 15 months. Both portfolios consist of stocks in the top fifth of analyst disagreement about future earnings. “Liquid stocks” (“Illiquid stocks”) are the fifth of these stocks with the highest (lowest) liquidity as measured by permanent price impact of trade. Portfolios are equal-weighted, with the lowest and highest return observations trimmed. The chart shows that mispricing is least (most) severe for the most (least) liquid stocks.

In summary, traders may have difficulty exploiting mispricing of stocks based on analyst disagreement about future earnings, because mispricing and trading friction rise and fall together. Small, nimble traders who carefully manage trading costs may have the best shot.