Is it feasible to isolate and exploit the value of entrepreneurial spirit among publicly traded stocks? In his Fall 2009 article entitled “Investing in Troubled Times: Entrepreneurs are Your Safest Bet”, Joel Shulman defines, filters and analyzes the performance of entrepreneurial stocks. Building on prior research, he defines “entrepreneurial” based on the following 15 attributes, several of which do not accommodate mechanical quantitative screening:
- Organic growth opportunities
- Above-average ownership stakes among key stakeholders
- Low selling, general, and administrative expenses
- Above average return on invested capital
- Sustainable growth
- Manageable debt
- Active strategic alliances/partnerships/licensing deals
- Aligned executive compensation packages
- Low executive turnover
- Transparent governance
- Long duration of key managers
- Low or no dividends
- Family involvement
- Strong earnings before interest, taxes, depreciation and amortization
- Other significant stakeholder relationships (such as key board members)
Using information for 9,000 publicly traded firms worldwide for which sufficient financial, stock return and other data are available over the period January 1997 through August 2009, he finds that:
- Entrepreneurial stocks concentrate in the U.S. information technology and consumer discretionary sectors.
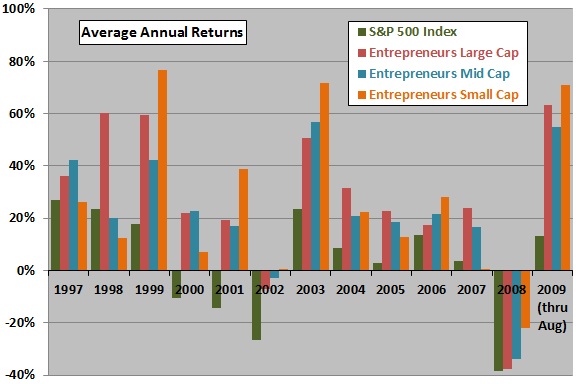
- Entrepreneurial stocks substantially outperform broad market indexes in most years over the sample period. This finding is robust to segmentation by market capitalization (see the first chart below), sector and geography.
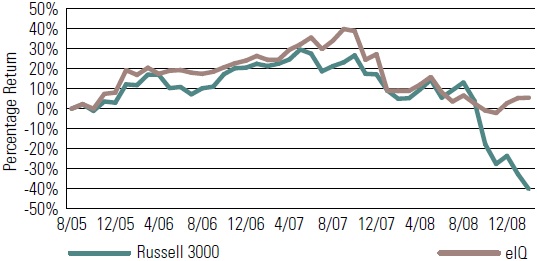
- A hedge fund that is long (short) the stocks of the 30-50 most (least) entrepreneurial firms during August 2005 through February 2009 generates a cumulative return of 4.7% (see the second chart below), far outperforming a buy-and-hold strategy on a broad index.
The following chart, constructed from data in the article, compares average annual (probably gross) returns for three portfolios of the 200 most entrepreneurial global stocks segmented by market capitalization to the S&P 500 Index over the entire sample period. Market capitalization segments are: Large Cap stocks, > $5 billion; Mid Cap stocks, $1 billion to $5 billion; and, Small Cap stocks, $0.25 billion to $1 billion. Entrepreneurial stocks outperform the broad stock market (and, not shown, indexes for relevant size segments) in most years, but do not completely defy bear markets.
The article does not specify the weighting method or reformation (substitution and rebalancing) interval for the entrepreneur portfolios. Equal weighting and annual reformation seem most likely.

The next chart, taken from the article, compares the (probably gross) cumulative performance of a hedge portfolio (eIQ) that is long the 30-50 most entrepreneurial stocks and short the 30-50 least entrepreneurial stocks to that of the Russell 3000 Index during August 2005 through February 2009. This hedge portfolio incorporates further filtering “based on…additional fundamental screens, liquidity, trading, and currency hedging constraints.” The hedge portfolio impressively keeps pace with or beats the Russell 3000 Index during the bullish part (first two years) of the 3.5-year test period. While the hedge fund unsurprisingly beats the index during the subsequent bearish part, it is inexplicably weak during much of this subperiod, with the least entrepreneurial stocks apparently outperforming the most entrepreneurial stocks.
The article does not specify the weighting method or rebalancing interval for the the hedge portfolios. Equal weighting seems most likely. Hedge portfolio positions turn over as new information becomes available, with most long positions having holding periods of six months to a year.

In summary, evidence indicates that stocks of entrepreneurial firms as defined by the 15 specifications may consistently outperform comparable companies that are not entrepreneurial.
In November 2010, John Shulman launched a mutual fund based on this research. Note that the performance data in the prospectus for this fund is for a similar managed account and not for the fund itself. The prospectus warns that:
“The performance of the Global Entrepreneur Managed Account, however, does not represent, and is not a substitute for, the performance of the Fund, and you should not assume that the Fund will have the same future performance as the Global Entrepreneur Managed Account. It is inappropriate and would be inaccurate for an investor to consider the Global Entrepreneur Managed Account’s performance below, either separately or together, as being indicative of the future performance of the Fund. …The Global Entrepreneur Managed Account’s performance shown is based on a gross of fee portfolio performance. The expenses of the Fund, including the Rule 12b-1 fees imposed on the Fund’s Class A and Retail Class shares, are higher than the expenses of the Global Entrepreneur Managed Account. The performance shown in the bar chart and table for the Global Entrepreneur Managed Account would be lower if adjusted to reflect the higher expenses of the Fund’s shares.“
Some additional cautions for investors considering this fundamental investing methodology are:
- Some the defining characteristics of entrepreneurial firms are qualitative and therefore problematic for independent verification of results.
- There may be substantial data snooping in the construction and optimization of the definition of entrepreneurial firms, thereby incorporating a material degree of luck into backtested returns.
- Returns reported in the article appear not to incorporate costs of data acquisition (reflected in management fees) and trading friction, which may materially reduce reported returns.
- The 3.5-year sample period for the hedge portfolio test is very short, and with the sharp market decline of late 2008 through February 2009, especially favorable to a hedge fund in comparison to a long-only stock index.