Does a high dividend yield translate on average to high total return? In the February 2008 version of their paper entitled “Dividend Yield Strategy in the British Stock Market: 1994-2007”, Janusz Brzeszczynski, Kathryn Archibald, Jerzy Gajdka and Joanna Brzeszczynska examine the recent performance of an equally-weighted portfolio of UK stocks with the highest dividend yields. Using total dividend-reinvested return data for portfolios of the Top Ten highest dividend yield stocks in the FTSE 100, reformed annually on the first trading day in March, and for the index itself over the period 1994-2007 (13 years), they conclude that:
- The average annual return of the Top Ten portfolios over the entire sample period is more than four times higher than that of the market index, significant both statistically and economically (considering transaction costs, taxes and risk).
- The arithmetic mean annual return for the Top Ten portfolios (FTSE 100 index) is 15.7% (6.3%).
- The geometric mean annual return for the Top Ten portfolios (FTSE 100 index), compounded monthly, is 13.5% (5.8%).
- The standard deviation of returns for the Top Ten portfolios (FTSE 100 index) is 28.7% (17.2%).
- Commonly used risk adjustments ((Sharpe ratio, Treynor ratio and Jensen’s alpha) also indicate that the high-yield portfolios have mostly outperformed the broad market.
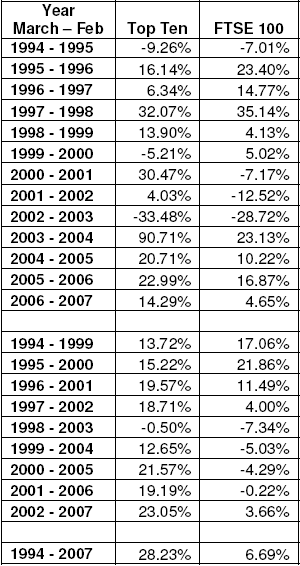
- The Top Ten portfolios outperform the FTSE 100 index in seven of 13 years and seven of nine five-year subperiods within the overall sample period (see the table below).
The following table, extracted from the paper, compares the returns by year and the compound annual return during five-year subperiods for the Top Ten highest dividend portfolios and the FTSE 100 index over the entire sample period of 1994-2007. As noted, the Top Ten portfolios beat the index in seven of 13 years and seven of nine five-year subperiods. Over the entire sample period, the compound annual return of the Top Ten portfolios (FTSE 100 index) is 28.2% (6.7%).

In summary, evidence from this UK study supports a belief that a portfolio of stocks with high dividend yields outperforms the broad market most of the time.