Can investors tell when management is unsustainably propping up the stock price of a company? In their June 2008 paper entitled “Identifying Overvalued Equity”, Craig Nichols and M. D. Beneish devise and test a method for predicting stock price declines that integrates observable accounting, operating, investing and financing data indicative of management efforts to sustain overvaluation. Specifically, they relate future stock returns to an overvaluation score (O-Score, ranging from zero to five points) calculated by assigning one point each for the following indications: (1) likely earnings overstatement; (2) high sales growth; (3) low operating cash flow to total assets; (4) an acquisition in the last five years; and, (5) unusual amounts of equity issuance in the past two years. Using 27,427 firm-year observations over the period 1993-2004 (with financial services and very small companies excluded), they conclude that:
- Over the entire sample period, stocks of firms with an O-Score of 0 (5) on average earn modestly positive (dramatically negative) abnormal returns of 4.5% (-26.9%) over the next year, with 51.8% (76.4%) of the returns negative. Average abnormal return decreases and percentage of negative returns increase systematically with increasing O-Score.
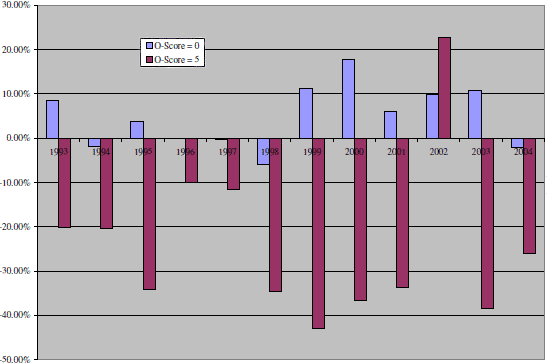
- This finding is largely stable by year, with an O-Score of 5 indicating a negative average return in 11 of 12 years (see the chart below).
- The predictive power of O-Score is consistent for companies of different size, with average abnormal one-year returns for an O-Score of 5 of -21.4% (-31.5%) for firms with market capitalization between $100 and $250 million (greater than $1 billion).
- 3.81% (1.05%) of high (low) O-Score firms restate their earnings.
The following chart, taken from the paper, compares the average size-adjusted returns by year across the entire 12-year sample period for firms with O-Score 0 and firms with O-Score 5. Only in 2002 did firms with “propped up” stock prices outperform.

In summary, investors may be able to predict which stocks are headed for substantial declines the next year as management efforts to keep the the price propped up fail.