Since 7/9/09, Christophe Faugère has been publishing (almost) daily “Market Estimates” of the value of the S&P 500 Index based on Required Yield Theory (RYT). RYT views investors as: (1) requiring that U.S. stocks and bonds in aggregate prospectively provide a real after-tax yield directly related to real long-term GDP per capita growth; and then, (2) deciding between stocks and bonds based on the better after-tax real return. To test the predictive power of these market estimates, we focus on daily percentage mismatches between estimated and actual values of the S&P 500 Index [(Estimated-Actual)/Actual] and exploitability of these mismatches via S&P Depository Receipts (SPY). Using daily RYT market estimates and daily levels of the S&P 500 Index and SPY over the period 7/9/09 through 3/3/10 (160 daily model outputs), we find that:
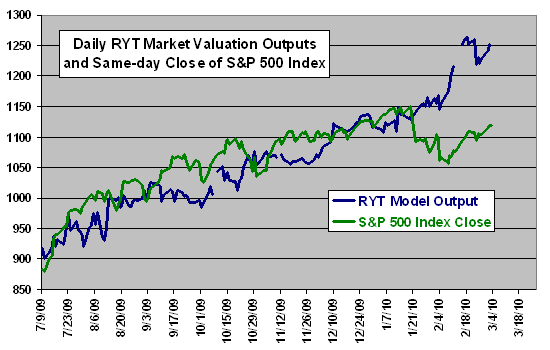
The following chart compares the daily RYT Model estimate of the value of the S&P 500 Index (published after the market close) and the actual closing level of the index for the same day over the sample period. Gaps in the model output represent trading days for which there is no model output. The average daily difference between the model estimate and the index is -0.19%. Visual inspection indicates no obvious relationship between mismatches and future behavior of the index. During January 2010, the RYT Model outputs changed from being mostly below to being well above the index modeled.
Do RYT Model-index mismatches indicate exploitable future returns?

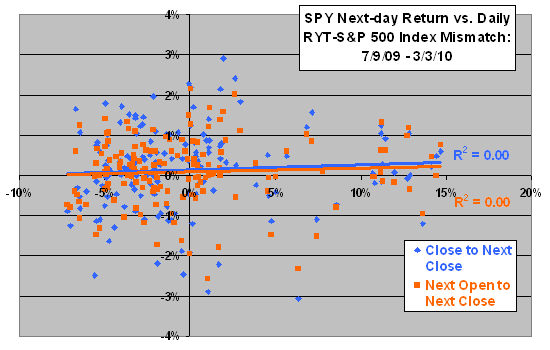
The following scatter plot relates the next-day gross return for SPY (both for same-day close-to-next close and next open-to-next close) to the daily mismatch between the RYT estimate of the value of the S&P 500 Index and the actual level of the index over the entire sample period. The chart shows that next-day returns for SPY tends to increase with the size of the daily RYT Model-index mismatch. The Pearson correlation for the same-day close-to-next close (next open-to-next close) relationship is 0.06 (0.05) and the R-squared statistic is 0.00 (0.00), indicating that variation in the daily mismatch explains none of the variation in next-day SPY return.
Over the entire sample period, the daily RYT Model-index mismatches are positive 39% of the time, while the next-day gross returns for SPY are positive 60% (57%) of the time when calculated from close-to-next close (next open-to-next close).
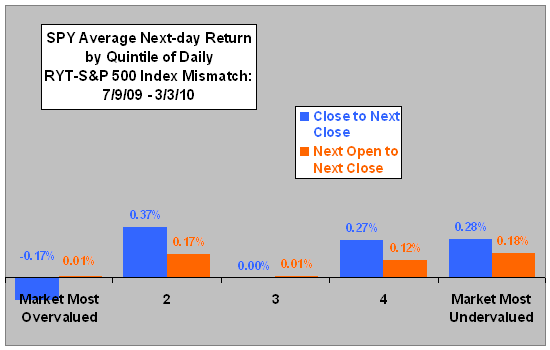
For another perspective, we look at average next-day SPY gross return by quintile of daily RYT Model-index mismatches.

The next chart summarizes the average next-day SPY gross returns by quintile of daily mismatches between the RYT estimates of the value of the S&P 500 Index and the actual levels of the index over the entire sample period. Progressions are not systematic.
An investor trading based on the RYT Model-index mismatch might sometimes hold overnight, so realistic gross return quintiles may be a blend of the two cases shown. Net profitability after trading frictions appears problematic.
These quintiles are small (32 observations each).
For an additional perspective on variability versus predictability, we return to daily data.

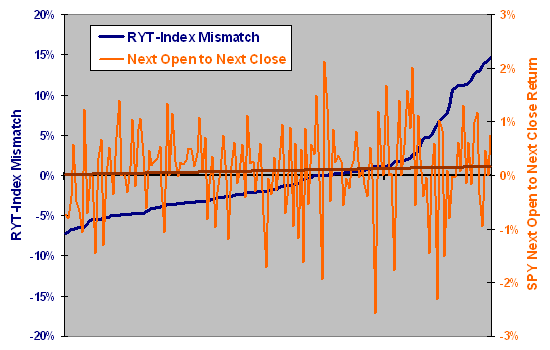
The final chart recasts the daily relationship between the RYT model-index mismatch and the next-day (next open-to-next close) return for SPY by ordering the mismatches from lowest value (S&P 500 Index 7.21% overvalued at the close on 10/20/09) to highest value (S&P 500 Index 14.67% undervalued at the close on 2/17/10) for the entire sample. The horizontal axis is therefore not time-sequential. The brown line is the best-fit linear trend for the SPY return data. Results indicate that trading the RYT Model-index mismatch on a daily basis is risky, with no particular range of mismatches promising.

Note that the sample period does not yet include much variety in general market conditions.
In summary, evidence from simple tests on a modest sample indicates that the RYT Model has little or no power to predict short-term behavior of the broad U.S. stock market.