Does adjusting an asset allocation retirement glidepath according to a stock market valuation metric such as Shiller’s cyclically adjusted price-earnings ratio (CAPE ratio or P/E10) improve the outcome? In their September 2014 paper entitled “Retirement Risk, Rising Equity Glidepaths, and Valuation-Based Asset Allocation”, Michael Kitces and Wade Pfau investigate the interaction of pre-determined allocation glidepaths and P/E10 valuation based on long-run U.S. historical data. They consider the following strategy alternatives:
- Fixed equity allocations of either 45% or 60%.
- Declining (accelerated declining) equity glidepaths that start retirement at 60% stocks and reduce the allocation by 1% (2%) per year.
- Rising (accelerated rising) equity glidepaths that start retirement at 30% stocks and increase the allocation by 1% (2%) per year.
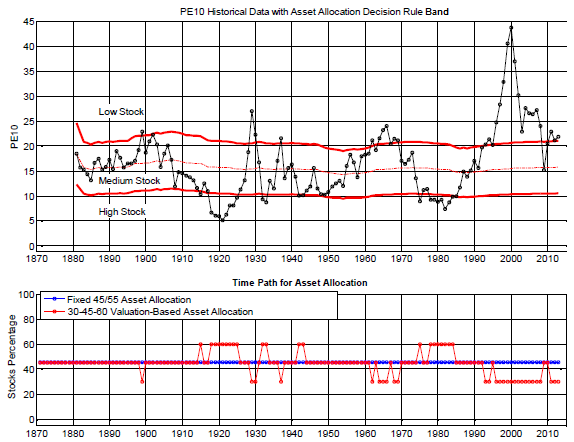
- A standalone dynamic valuation-based strategy with baseline 45% equity, raised (lowered) to 60% (30%) at the beginning of any year for which P/E10 is less than (greater than) 67% (133%) of its inception-to-date median. (See the chart below.)
- Unbounded and bounded combinations of declining or rising glidepaths and the dynamic valuation-based strategy, adding (subtracting) 15% from the equity glidepath at the beginning of any year for which P/E10 indicates undervaluation (overvaluation). Bounded combinations constrain equity allocation to a minimum 30% and a maximum 60%.
They consider both short-term bills (six months to a year) and long-term bonds (10-year) as complements to equities. They use overlapping 30-year intervals to approximate retirement outcomes. They focus on worst-case maximum sustainable real (inflation-adjusted) withdrawal rate over the 30-year retirement interval as the main strategy performance metric. Withdrawals occur at the beginning of each year, with the residual portfolio then rebalanced to target allocations. They assume withdrawals pay the taxes. Using Robert Shiller’s monthly data for U.S. stock market returns, associated P/E10, short-term bill yields (six-month commercial paper/one-year U.S. Treasury notes) and long-term bond yields (10-year U.S. Treasury notes or equivalent) during 1871 through 2013, they find that:
- Based on worst-case sustainable maximum withdrawal rate over the entire sample period, without considering P/E10 valuation:
- The fixed 60% equity allocation performs second best paired with bills (4.10%) and best paired with bonds (3.62%).
- The accelerated rising equity glidepath performs best with bills (4.21%) and second best with bonds (3.59%).
- The accelerated declining equity glidepath performs worst with both bills and bonds (3.44% and 3.47%).
- Pairings with bills outperform pairings with bonds for five of six alternative strategies.
- Findings differ from those based on Monte Carlo simulations that do not include mean reversion.
- Based on worst-case sustainable maximum withdrawal rate, considering the equity valuation state and including the dynamic valuation-based strategies:
- When pairing equity with bills, the top-performing strategy is:
- When stocks are undervalued at the start of retirement, the unbounded combination of declining glidepath and the dynamic valuation-based strategy (5.80%).
- When stocks are fairly valued at the start of retirement, the standalone dynamic valuation-based strategy (4.50%).
- When stocks are overvalued at the start of retirement, the unbounded combination of accelerating rising glidepath and the dynamic valuation-based strategy (4.23%).
- When pairing equity with bonds, the unbounded combination of declining glidepath and the dynamic valuation-based strategy performs best regardless of valuation state at retirement.
- Pairings with bills again mostly outperform pairings with bonds, least so when stocks are initially undervalued.
- There appear to be further benefits from making the valuation-based adjustments larger than 15%.
- When pairing equity with bills, the top-performing strategy is:
- Based on median terminal wealth for a set 4% withdrawal rate, considering all strategies:
- When pairing equity with bills, the top-performing strategy is:
- When stocks are undervalued or fairly valued at the start of retirement, the fixed 60% equity allocation.
- When stocks are overvalued at the start of retirement, the unbounded combination of accelerating rising glidepath and the dynamic valuation-based strategy.
- When pairing equity with bonds, the top-performing strategy is:
- When stocks are undervalued at the start of retirement, the unbounded combination of accelerating rising glidepath and the dynamic valuation-based strategy.
- When stocks are fairly valued at the start of retirement, the fixed 60% equity allocation.
- When stocks are overvalued at the start of retirement, the unbounded combination of declining glidepath and the dynamic valuation-based strategy.
- When pairing equity with bills, the top-performing strategy is:
The following charts, taken from the paper, track historical P/E10 with thresholds for adjusting the equity allocation (upper chart) and the associated equity allocation (lower chart) over the entire sample period. There are 28 allocation changes, an average of one every five years. Of 133 years for which P/E10 is available: 84 years have the base 45% equity allocation; 21 years have the 60% equity allocation (because P/E10 is less than 67% of its historical median); and, 28 years have a 30% equity allocation (because P/E10 is greater than 133% of its historical median).
In summary, evidence suggests that the optimal asset allocation strategy during retirement depends on the initial equity valuation state, and applying dynamic valuation-based strategies generally enhance retirement funding.
Cautions regarding findings include:
- Testing many alternative strategies on the same data impounds data snooping bias, such that results for the best-performing alternative overstate expected performance.
- Results are gross, not net. Including annual portfolio rebalancing frictions (relatively high over parts of the sample period) over 30 years would materially reduce performance.
- As noted, results do no account for taxes due on withdrawals.