Are “quality” country stock markets good places to invest? In his December 2013 paper entitled “Quality Investing and the Cross-Section of Country Returns”, Adam Zaremba investigates whether aggregate financial quality determines country stock market performance. Specifically, he uses two-month lagged 12-month data for listed firms to calculate the following eight quality metrics at the country level in each of 66 countries:
- Return on Assets (ROA) – ratio of net income to average assets.
- Return on Equity (ROE) – ratio of net income to average common equity.
- Profit Margin (PM) – ratio of net income to sales.
- Operating Margin (OM) – ratio of operating income to sales.
- Gross Margin (GM) – ratio of gross income (sales minus cost of goods sold) to sales.
- Assets to Debt (AD)- ratio of total assets to short-term plus and long-term borrowings.
- EBITDA to Debt (ED) – ratio of EBITDA to short-term plus long-term borrowings.
- Current Ratio (CR) – ratio of current assets to current liabilities.
He uses MSCI country indexes to measure country market returns. He also calculates for each country the total market capitalization, aggregate book-to-market ratio and 12-month market return momentum. He tests relationships between country-level quality factors and returns by constructing portfolios of the equally weighted top 30% (high-quality), middle 40% (mid-quality) and bottom 30% (low-quality) of country markets based on each quality metric. He also measures for each quality metric the performance of a fully collateralized portfolio that is each month long (short) the equally weighted 30% of country markets with the highest (lowest) quality. To test sensitivity to the currency used, he perform all calculations separately in U.S. dollars, euros and yen. Using monthly accounting and return data as specified during May 2000 through October 2013, he finds that:
- High-quality country stock markets outperform mid-quality and low-quality markets as measured by all quality metrics except CR.
- Similarly, hedge portfolio that are long (short) high-quality (low-quality) country markets generate positive gross returns for all metrics except CR. Gross three-factor (market, size, book-to-market) alphas are significantly positive for hedge portfolios based on ROA, GM, AD and ED.
- Debt ratios (AD and ED) are most effective in segregating weak and strong country stock markets.
- Quality ratios do not relate strongly to the size, book-to-market and momentum factors. In general, sorting on one quality metric and one of these three factors beats the quality metric alone.
- The combinations of high-ED and high-momentum may be optimal, generating a gross monthly return (three-factor alpha) of 1.84% (1.82%).
- High-quality stocks perform better in country markets with small market capitalizations, high book-to-market ratios and strong momentum.
- Results are very similar whether calculated in dollars, euros or yen.
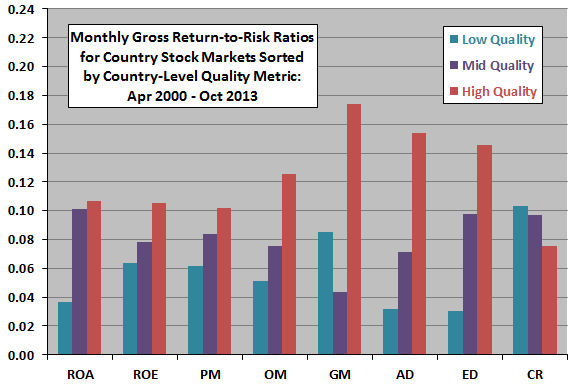
The following chart, constructed from data in the paper, summarizes monthly gross return-to-risk ratios for country stock markets sorted by each of eight prior-month country-level quality metrics measured in U.S. dollars over the sample period. The risk measure is standard deviation of monthly returns. Low-quality markets are in the bottom 30% of the quality metric. Mid-quality and high-quality markets are the middle 40% and top 30%, respectively.
For six of eight metrics, mid-quality markets outperform low-quality markets. For seven of eight metrics, high quality markets outperform both mid-quality and low-quality markets.
In summary, recent evidence indicates that quality measures that explain variation in individual stock performance also explain in aggregate forms variation in country stock market performance.
Cautions regarding findings include:
- Return calculations are gross, not net. Including the costs of monthly portfolio reformation would reduce reported returns.
- Use of country indexes rather than tradable assets ignores the costs of maintaining liquid tracking funds. These costs may vary by country.
- Hedge portfolio calculations ignore costs of shorting country indexes.
- The sample period, limited by data availability, is short for testing annual metrics. It is very short in terms of variety of worldwide economic conditions.
- Calculating quality metrics at the country market level is infeasible for most investors.