Do the stocks of firms that get the most bang per research buck tend to outperform? In the March 2011 update of their paper entitled “Innovative Efficiency and Stock Returns”, David Hirshleifer, Po-Hsuan Hsu and Dongmei Li investigate the relationship between innovative efficiency (IE) and future stock returns. They consider three alternative definitions of IE: (1) patents granted per dollar of R&D capital investment two years previous; (2) patents granted per dollar of R&D expenditures two years previous; and, (3) adjusted patent citations (a measure of patent quality) per dollar of cumulative R&D expense over the five years ending two years previous. The two-year lag between patent activity and investment in R&D reflects the average patent application-grant delay. Return predictability tests involve annually reformed value-weighted stock portfolios comprised of six intersections derived from independent sorts at the end of each February into: small or big market capitalization; and, low, middle or high IE. Using accounting and patent data for a broad sample of U.S. firms over the period 1981 through 2006, and associated stock returns and risk adjustment factors through February 2008, they find that:
- There is a significantly positive relation between the three IE metrics and future stock returns. This relationship is robust to controlling for firm size, book-to-market ratio, return momentum, R&D-to-sales ratio, R&D growth, return on assets, asset growth, net stock issuance, industry and institutional ownership.
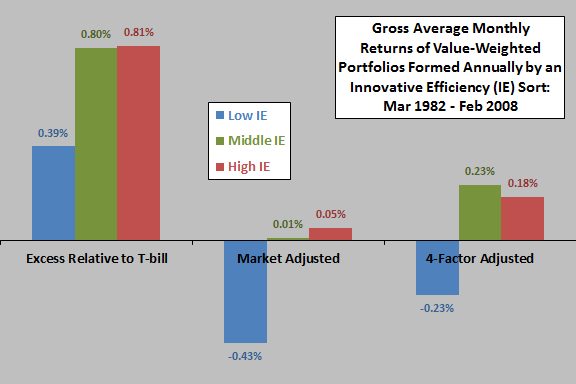
- The monthly value-weighted and size-adjusted gross returns relative to the one-month Treasury bill (T-bill) yield of hedge portfolios that are long stocks of high IE firms and short the stocks of low IE firms range from 0.28% to 0.42% over the entire sample period. Corresponding monthly four-factor (adjusting for market, size, book-to-market, momentum) gross alphas range from 0.38% to 0.42%. (The first chart below provides detail for the second IE metric defined above.)
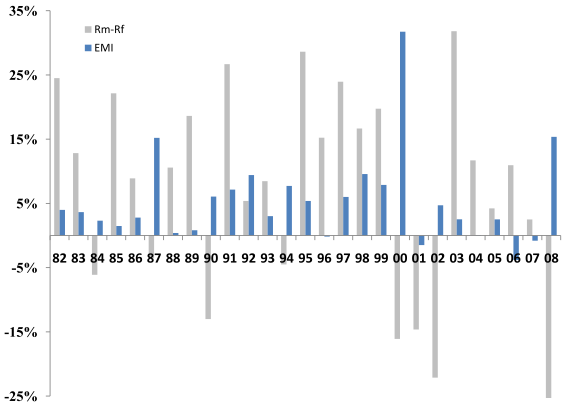
- On an annual basis, the hedge portfolio for the first IE metric defined above is generally of low risk, generating positive returns in 22 of 27 years with no large drawdowns (see the second chart below).
- Results suggest that mispricing arising from investor inattention, rather than a rational risk-return calculation, drives the IE-return relationship.
The following chart, constructed from data in the paper, summarizes gross average monthly performance of low, middle and high IE value-weighted, size-adjusted portfolios reformed at the end of February each year from 1982 through 2007 and held for 12 months based on: (1) returns in excess of the T-bill yield; (2) market-adjusted returns; and, (3) returns adjusted for market, size, book-to-market and momentum factors. The IE metric used here is patents granted per dollar of R&D expenditures two years previous. Size adjustment involves averaging results for the small and big intersections for each level of IE. Results for the other two IE metrics described above are similar.
Results suggest that inefficient innovators (Low IE) drive the anomaly with respect to market-adjusted returns.

The next chart, taken from the paper, compares annual value-weighted market returns in excess of the T-bill yield (Rm – Rf) to gross annual returns for a efficient-minus-inefficient (EMI) hedge portfolio during March 1982 through February 2008. Hedge portfolio formation involves exploiting the value-weighted intersections of two independent sorts on market capitalization and IE as described above, with the long side an average of the small-high IE and big-high IE intersections and the short side an average of the small-low IE and big-low IE intersections.
EMI hedge gross returns are negative in only five years out of 27 years, compared to eight for market excess returns. Also, EMI returns are almost always positive when market excess returns are negative (most notably for 2000 and 2008).

In summary, evidence indicates that equity investors may be able to beat the market by exploiting innovative efficiency as a stock selection criterion.
Cautions regarding findings include:
- The methodology may involve material data collection costs.
- Returns presented are gross, not net. Incorporation of reasonable trading frictions would reduce returns and alphas, and stocks of firms with the most extreme IE values may be the most costly to trade. However, annual portfolio reformation mitigates this concern.
- As indicated in the first chart above, the short sides of IE hedge portfolios appear crucial to beating the market. Shorting constraints may inhibit implementation, and shorting costs may be material.