Is it practical to compare valuations of different stock markets? In his August 2012 paper entitled “Global Value: Building Trading Models with the 10 Year CAPE”, Mebane Faber investigates the usefulness of 10-year cyclically adjusted price-to-earnings ratio (CAPE, or P/E10) in determining relative values for 32 country stock markets. Specifically, he ranks all country markets based on P/E10 each year starting in 1980 and reforms equally weighted portfolios annually of those market indexes with the lowest and the highest relative valuations. He uses an equally weighted, annually rebalanced portfolio of all country indexes as a benchmark. Using annual real total returns (in local currencies) and 10-year average lagged aggregate real earnings for all 32 country stock markets as available through 2011, he finds that:
- Due to data limitations, the evolving sample consists of about 10 countries in 1980, 20 in 1990 and 30 by 2000.
- The portfolio of the most undervalued (overvalued) country indexes outperforms (underperforms) the benchmark by about 4% to 7% per year depending on relative valuation threshold (top/bottom third, quarter, tenth or three).
- Applying a filter that substitutes zero-return cash for relatively undervalued (overvalued) indexes with P/E10 values above 15 (below 30) generally improves performance and reduces drawdowns of a long-short portfolio.
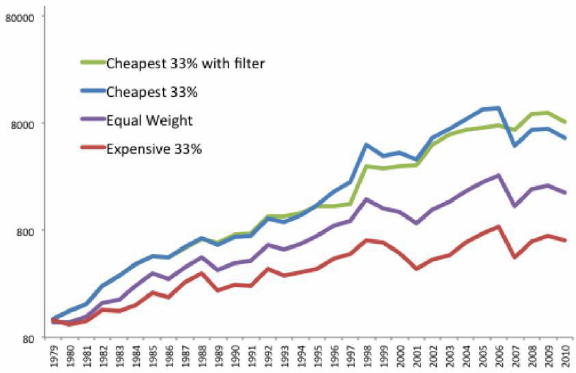
The following chart, taken from the paper, compares gross cumulative values of $100 initial investments from the end of 1979 through 2011, calculated annually, in four portfolios:
- Cheapest 33%: an equally weighted portfolio of the third of available country indexes with the lowest values of P/E10, reformed annually.
- Cheapest 33% with filter: same as Cheapest 33%, but substituting zero-return cash for any of the cheapest indexes with P/E10 above 15.
- Equal Weight: an equally weighted, annually rebalanced portfolio of all country indexes in the sample.
- Expensive 33%: an equally weighted portfolio of the third of available country indexes with the highest values of P/E10, reformed annually.
Results show that relatively undervalued (overvalued) stock indexes outperform (underperform) the Equal Weight benchmark. Applying the filter to Cheapest 33% lowers volatility while preserving performance.

In summary, evidence from available data indicates that investors may be able to exploit relative country stock market valuations based on local P/E10.
Cautions regarding findings include:
- The study employs indexes rather than tradable assets, tending to overstate the returns an investor would experience after bearing the trading frictions and management fees associated with index-tracking funds. These costs would likely vary over time and across countries and could be highest for the countries offering the highest gross returns.
- The study ignores trading frictions associated with annual portfolio rebalancing, incremental to tradable asset formation costs but mitigated by infrequent actions. Shorting indexes could be costly and may not always be feasible.
- Filter thresholds for country indexes that are not undervalued or overvalued enough may impound look-ahead bias (based on knowledge of the entire sample period).
- Available country index sample periods are generally not long in terms of independent ten-year earnings measurement intervals. The considerable overlap in annual P/E10 calculations may exaggerate apparent robustness of findings.
See “Predictive Power of P/E10 Worldwide” and “Testing P/E10 in Developed Markets” for related studies.