Do investors systematically and exploitably underreact to deviations in firm fundamentals from recent averages? In their January 2020 paper entitled “Anchoring on Past Fundamentals”, Doron Avramov, Guy Kaplanski and Avanidhar Subrahmanyam investigate how deviations of quarterly firm accounting variables from averages over recent quarters relate to future returns across stocks. They first construct a stock performance deviation index (PDI) based on seven variables: (1) cash and short-term investments, (2) retained earnings, (3) operating income, (4) sales, (5) capital expenditures, (6) invested capital and (7) inventories. They then each month for each stock starting June 1977:
- Calculate the deviation for each variable as the difference between its most recent quarterly value and its average over the preceding three quarters, scaled by total assets.
- Rank each deviation (in percentiles) relative to deviations for the same variable for all stocks.
- Calculate PDI for a stock as the equally weighted average of percentile rankings across all seven variables.
They extend this approach to a more comprehensive fundamental-based deviation index (FDI) that considers deviations of all Compustat accounting variables plus 14 commonly used accounting ratios, with weights of deviation percentile rankings optimized via least absolute shrinkage and selection operator (LASSO) regression starting January 1979. For all variables, if the exact release date is unavailable, they assume a 60-day delay in release. For portfolio tests, they calculate returns to hedge portfolios that are long (short) stocks in the top (bottom) tenth, or decile, of PDIs or FDIs, with holding intervals ranging from one to 24 months. Using monthly data needed to construct PDI, FDI and 30 style, technical, fundamental and liquidity control variables across a broad sample of reasonably liquid U.S. common stocks with positive book values and prices over $5 during January 1976 through October 2017, they find that:
- Monthly correlations between PDI/FDI and each of several other widely used stock return predictors are mostly near zero, with a maximum about 0.20, indicating unique information content of PDI/FDI.
- For monthly rebalancing (1-month holding interval) over the full sample period, the PDI hedge portfolio generates annualized gross 4-factor (market, size, book-to-market and momentum) alphas ranging from 8.3% for value weighting and exclusion of microcaps to 16.2% for equal weighting and inclusion of microcaps (see the chart below). Corresponding breakeven rebalancing frictions range from 1% to 2%. Gross alphas decline, but breakeven rebalancing frictions rise, as holding interval increases.
- FDI generates annualized gross 4-factor alphas from a monthly rebalanced hedge portfolio ranging from 5.8% for value weighting to 18.7% for equal weighting over the full sample period. Alphas versus other published factor models of stock returns are mostly a little higher.
- The PDI/FDI effect:
- Survives risk adjustment as measured by Sharpe ratio.
- Holds for both long and short sides of the hedge portfolio, but is considerably stronger for the long side.
- Exceeds those of momentum, 52-week highs, profitability and other prominent anomalies.
- Persists in recent years when most anomalies weaken.
- Persists across different states of the economy and across states of high and low market sentiment, liquidity and volatility.
- Is stronger for sudden than gradual deviations in variables.
- PDI/FDI hedge portfolio profits show no signs of reversal even after two years, consistent with investor underreaction as the driver. Moreover, top PDI/FDI stocks are not markedly different from other stocks in terms of size, liquidity, institutional holdings or earnings forecast dispersion.
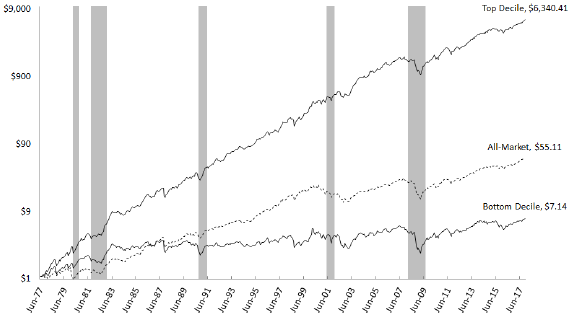
The following chart, taken from the paper, compares cumulative and terminal values of $1 initial investments in equally weighted top and bottom PDI deciles, reformed monthly over the full sample period, along with that for the value-weighted market. Gray bars represent NBER-defined economic contractions.
In summary, evidence indicates that investors can exploit underreaction by others to deviations from recent levels of firm accounting variables.
Cautions regarding findings include:
- Reported returns, alphas and Sharpe ratios are gross, not net. Accounting for cost of data, portfolio rebalancing frictions and shorting costs would reduce performance. Shorting may not always be feasible as specified due to lack of shares to borrow.
- As shown in the chart, the long side of the PDI hedge portfolio does not avoid market crashes.
- The methodology described (especially for FDI) is beyond the reach of most investors, who would bear fees for delegating to a fund manager.