A reader asked: “Can you look into the predictions of Martin Armstrong? He may be one of the most interesting and out-of-the-box thinkers on the markets. He supposedly predicted the 1987 crash, the Japanese crash and the top of our real estate market to the day.”
Retrospective sampling of forecasts by the expert doing the forecasting (or an associate) is suspect. For promotional reasons or due to confirmation bias, experts may report successes and ignore (or deny the significance of) failures.
A scan of the recent writings of Martin Armstrong (sent from prison) posted at the “unofficial” MartinArmstrong.org generates a few examples of forecasts for the U.S. stock market, as proxied by the Dow Jones Industrial Average (DJIA). Martin Armstrong’s writings there are more storytelling (fitting selected past events to themes) than analysis. Themes focus strongly on cycles of business/economic/investing behavior.
The sample is too small for useful inference. The duration of the sample (less than two years) is small compared to forecast horizons, such that many forecasts are still pending. Also, conditionality/hedging of outlooks makes assessing forecast accuracy difficult. Specifically:
The following hedged outlook is from Martin Armstrong’s 12/18/08 commentary “We Are Alone”. The intuition that the U.S. stock market might fall sharply proved correct. However, the forecast that the drop would end “as early as April 2009 to June 2009” is substantially incorrect (one to three months late within a six-month forecast horizon). The destination of the drop for the DJIA is also substantially incorrect (4,000 versus an actual 6,440 on March 9, 2009).

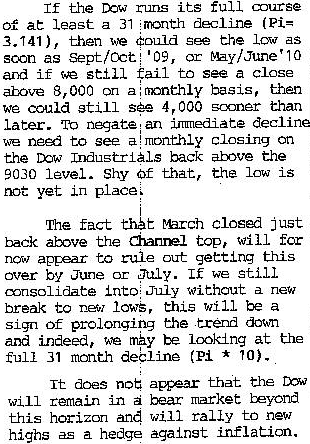
The next very conditional outlook is from Martin Armstrong’s 5/15/09 commentary “Understanding the Real Economy”. There was no DJIA low in Sep/Oct 2009 (there could still be one in May/Jun 2010). Conditionalities make these forecasts difficult to assess and may provide the means to claim accuracy on many alternative market evolutions.

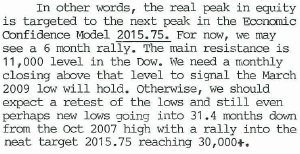
The next outlook is from Martin Armstrong’s 8/14/09 commentary “Will the Dow Reach 30,000 by 2015”. During 8/14/09-2/14/10, the DJIA rallied to January and then pulled modestly back, so one could judge the short-term part of the forecast essentially correct. The longer-term forecasts of a major low in mid-2011 and a major high in late 2015 are pending.

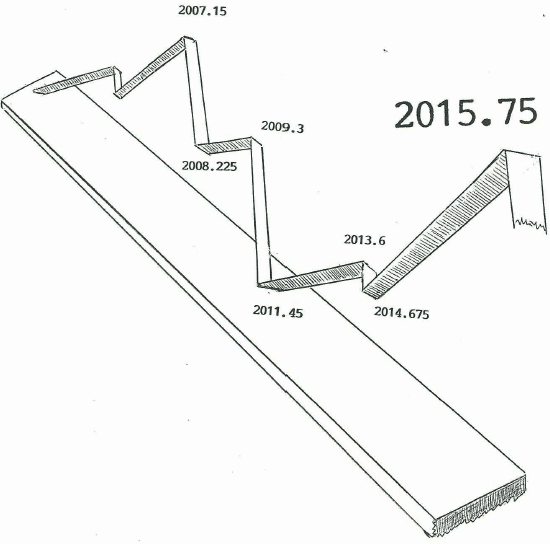
The following figure is also from Martin Armstrong’s 8/14/09 commentary (the front page). Partial iterations of the figure appear in earlier writings. The indication of a relative minimum in the DJIA during the first quarter of 2008 is incorrect. The indication of a relative maximum about a third of the way into 2009, followed by a steady decline is incorrect. As noted above, the indications of a major low in mid-2011 and a major high in late 2015 are pending.

The above evidence seems insufficient to support a belief that Martin Armstrong is an exceptional market forecaster.
A reader commented on 3/3/10:
“I don’t think you understand his model. I suggest you read “8.6 Year Review” [from 6/14/06 by Martin Armstrong] and “Economic Confidence Model” [from 6/14/06 with no author indicated]. The economic confidence model has a statistical significance into the billions to one odds. Pay attention especially to the highest and lowest points on the model, the minor points in between are less reliable and do not always mean a high or low, just a turn.”
Response:
Both citations are largely retrospective, with events sampled by Martin Armstrong or an associate. The cautions at the beginning of the brief review above about potential biases apply. The latter citation appears to include material added after the 6/14/06 publication date, as follows:
“2007.15 is projected by Martin to be a peak in commodity prices including Gold, however it could extend out into 2012 according to him. In general the model indicated that everything would inflate again after the 2002 low, with an emphasis on hard assets – commodities, real estate etc. but given that the dow jones 30 took the lead and made new highs into the 2007 cycle date while commodities and housing (actually the Schiller Housing index peaked on the Feb. 2007 Pi Cycle date, as did the Nikkei and the Financial Indices)peaked earlier that shows that capital had turned back to stocks (especially the blue chips) again. ” [sic]
Readers are free to investigate further or not.