When media recommend stocks, should investors pay attention? To check, we look at performance of stock recommendations for 2019 from December 2018 articles in several publications. Specifically, we test:
- 10 buy recommendations from InvestorPlace published 12/13/2018.
- 19 buy recommendations from Kiplinger published 12/7/2018.
- 8 buy recommendations from Motley Fool published 12/13/2018, 12/21/2018 and 12/22/2018.
- 10 buy recommendations from TheStreet published 12/3/2018 and 12/14/2018.
- 19 buy recommendations from USA Today published 12/28/2018.
- 8 buy recommendations from US News published 12/14/2018.
For each source, we form equally weighted portfolios of recommended stocks at the close on 12/31/2018 and hold without rebalancing. For a broader perspective, we form an equally weighted portfolio of all recommended stocks (Overall). Because the sample period is very short, we focus on daily performance statistics, but also look at cumulative returns. We use SPDR S&P 500 (SPY) as a benchmark. Using daily dividend-adjusted prices of the 74 recommended stocks and SPY during 12/31/2018 through October 15, 2019, we find that:
Three stocks have incomplete series due to mergers/spin-offs (FOXA, DWDP, CTRL). For these stocks, we assume allocations are in cash with no return when the stocks are unavailable. For the three duplicates among recommendations (ADBE, AMZN, NFLX), we include two copies of each in the Overall portfolio. We ignore costs of opening and closing stock positions, to the disadvantage of the benchmark.
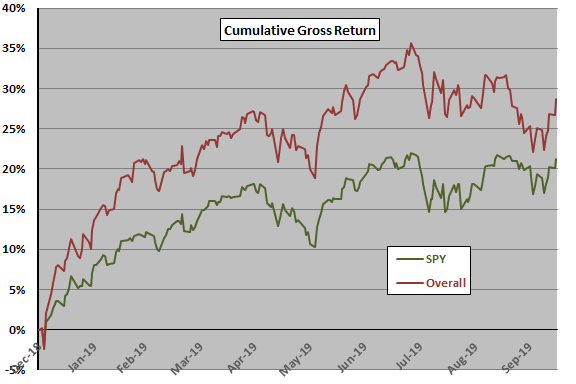
The following chart tracks cumulative gross returns for the Overall portfolio and SPY over the test period. Notable points are:
- The test period is mostly bullish for U.S. stocks, especially the first part.
- Overall is ahead of SPY at nearly all points in the test period, with a similar pattern.
To understand why Overall is ahead, we look at some detailed statistics.
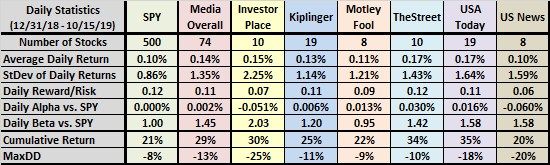
The following table summarizes test period performance statistics for the benchmark, the Overall media portfolio and for individual source portfolios, as follows:
- Average daily return.
- Standard deviation of daily returns.
- Daily reward/risk (average daily return divided by standard deviation of daily returns).
- Daily alpha vs. SPY (y-intercept of best-fit line for daily portfolio return versus daily SPY return).
- Daily beta vs. SPY (slope of best-fit line for daily portfolio return versus daily SPY return).
- Cumulative return at the end of the test period.
- Maximum drawdown (MaxDD) based on daily returns.
Notable points regarding media recommendation portfolios are:
- Almost all have higher average daily returns, and all have higher daily volatilities than SPY. Daily reward-to-risk ratios are mostly lower than that for SPY.
- Four of six alphas are positive, such that Overall alpha is slightly positive.
- All betas except one are materially higher than 1.00, thereby leveraging market direction.
- Due largely to high betas, most cumulative returns are higher than that of SPY.
- All have deeper MaxDDs than does SPY.
In summary, evidence from a short test of media stock recommendations suggests that they are often high-beta, outperforming when the market rises and likely underperforming when the market falls.
The stream of research on low-volatility investing indicates that a high-beta approach underperforms over the long term.
Cautions regarding findings include:
- As noted, reported statistics are gross, not net. Accounting for trading frictions for buying and selling stocks would reduce performance, to the disadvantage of SPY.
- Individual source subsamples are very small for reliable comparison.
- SPY may not be the best benchmark for media recommendations, which are equally weighted and hold some small stocks.
- As noted, the test period is largely bullish for U.S. stocks, favorable to high-beta portfolios.