What are potential monthly returns and alphas from applying machine learning to pick stocks? In their February 2019 paper entitled “Machine Learning for Stock Selection”, Keywan Rasekhschaffe and Robert Jones summarize basic concepts of machine leaning and apply them to select stocks from U.S. and non-U.S. samples, focusing on the cross-section of returns (as in equity factor studies). To alleviate overfitting in an environment with low signal-to-noise ratios, they highlight use of: (1) data feature engineering, and (2) combining outputs from different machine learning algorithms and training sets. Feature engineering applies market/machine learning knowledge to select the forecast variable, algorithms likely to be effective, training sets likely to be informative, factors likely to be informative and factor standardization approach. Their example employs an initial 10-year training period and then walks forecasts forward monthly (as in most equity factor research) for each stock, as follows:
- Employ 194 firm/stock input variables.
- Use three rolling training sets (last 12 months, same calendar month last 10 years and bottom half of performance last 10 years), separately for U.S. and non-U.S. samples.
- Apply four machine learning algorithms, generating 12 signals (three training sets times four algorithms) for each stock each month, plus a composite signal based on percentile rankings of the 12 signals.
- Rank stocks into tenths (deciles) based on each signal, which forecasts probability of next-month outperformance/underperformance.
- Form two hedge portfolios that are long the decile of stocks with the highest expected performance and short the decile with the lowest, one equal-weighted and one risk-weighted (inverse volatility over the past 100 trading days), with a 2-day lag between forecast and portfolio reformation to accommodate execution.
- Calculate gross and net average excess (relative to U.S. Treasury bill yield) returns and 4-factor (market, size, book-to-market, momentum) alphas for the portfolios. To estimate net performance, they assume 0.3% round trip trading frictions.
They consider two benchmark portfolios that pick long and short side using non-machine learning methods. Using a broad sample of small, medium and large stocks (average 5,907 per month) spanning 22 developed markets, and contemporaneous values for the 194 input variables, during January 1994 through December 2016, they find that:
- All machine learning hedge portfolios generate average monthly net returns over 1%.
- The overall composite machine learning hedge portfolio:
- Generates equal-weighted average gross (net) monthly excess return 1.60% (1.35%) and monthly gross (net) 4-factor alpha 1.84% (1.61%).
- Generates risk-weighted average gross (net) monthly excess return 1.95% (2.01%) and monthly gross (net) 4-factor alpha 1.67% (1.74%).
- Beats non-machine learning methods on both gross and net bases.
- Results for non-U.S. stocks are similar.
- In general:
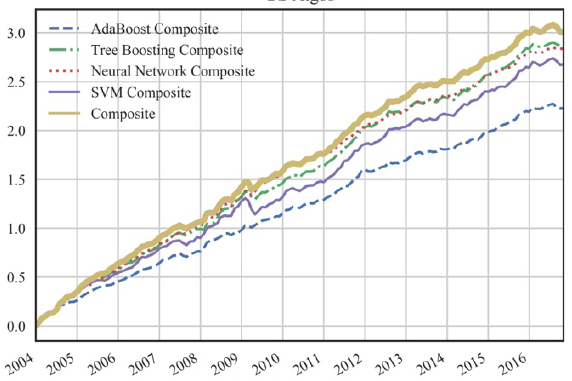
- Composite forecasts work better than forecasts from individual machine learning algorithms (see the chart below) and training sets. The benefit of combining training sets is especially strong.
- Risk weighting works better than equal weighting.
- Price trend, volatility and liquidity variables are by far the most important inputs. Percentage of shares sold short, difference between put and call implied volatilities and financial statement variables are also in the top ten.
- Based on variability of common factor exposures, some machine learning alpha appears to come from factor timing.
The following chart, taken from the paper, compares cumulative gross excess returns for five risk-weighted machine learning hedge portfolios for the U.S. sample:
- Four composites from combining three signals for each of four algorithms across training sets.
- An overall composite combining 12 signals from both algorithms and training sets.
The overall composite performs best. Results for equal-weighted U.S. portfolios and for non-U.S. stock portfolios are similar. The advantage of the overall composite relative to three composites from combining training sets across algorithms is even more pronounced.
In summary, evidence indicates that combining signals from multiple machine learning algorithms and multiple training sets generates attractive hedge stock portfolios.
Cautions regarding conclusions include:
- The assumed 0.3% round trip trading frictions may be unrealistically low. There may also be material shorting (stock borrowing) costs and constraints (lack of shares to borrow). Use of both equal weighting and risk weighting likely concentrate portfolios in stocks most costly to trade and short. The importance of volatility and liquidity input variables in determining the hedge portfolios amplifies this concern.
- Findings do not account for the likely delegated costs of acquiring, configuring and maintaining multiple machine learning algorithms and input data. These costs may be material relative to hedge portfolio performance.
- There may be look-ahead bias inherited from the “domain knowledge” (researcher experience) applied in assembling input variable and training sets, arguing for live testing.
- Widespread use of machine learning may affect the market, such that backtests on unaffected historical data may mislead.
See also: