Readers have proposed several hedging/shorting variations for “Simple Sector ETF Momentum Strategy Performance”, as follows: (1) buy the top and hedge with (short) the bottom sector based on past six-month return; (2) buy the top sector based on past six-month return and hedge it with a matched short position in the S&P 500 Index via ProShares Short S&P500 (SH); and, (3) buy the top (sell the bottom) sector when the S&P 500 Index is above (below) its 10-month simple moving average (SMA). The strategies apply to the following nine sector exchange-traded funds (ETF) defined by the Select Sector Standard & Poor’s Depository Receipts (SPDR), all of which have trading data back to December 1998:
Materials Select Sector SPDR (XLB)
Energy Select Sector SPDR (XLE)
Financial Select Sector SPDR (XLF)
Industrial Select Sector SPDR (XLI)
Technology Select Sector SPDR (XLK)
Consumer Staples Select Sector SPDR (XLP)
Utilities Select Sector SPDR (XLU)
Health Care Select Sector SPDR (XLV)
Consumer Discretionary Select SPDR (XLY)
Using monthly dividend-adjusted closing levels for the sector ETFs, SPDR S&P 500 (SPY), SH (as available) and the 3-month Treasury bill (T-bill) yield over the period December 1998 through December 2013 (182 months), we find that:
For all three hedging strategies, calculations assume the following:
- Reallocation occurs at the close on the last trading day of each month (accurate calculation of total six-month past ETF returns and the position of the S&P 500 Index relative to its 10-month SMA just before the close is feasible).
- Trading (switching) friction is 0.25% of the balance whenever there is a change in the ETF held or shorted.
- Ignore costs of shorting and any trading frictions for monthly rebalancing long and short sides.
- Return on cash for a benchmark strategy that goes to cash when the S&P 500 Index is below its 10-month SMA (6-1;SMA10) is equal to the T-bill yield at the time of allocation.
- Ignore effects of hedging on capital requirements.
- Ignore any tax implications of trading.
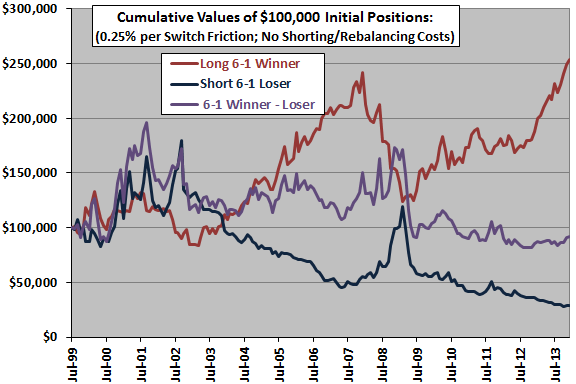
The following chart compares cumulative values of $100,000 initial investments that each month are long the sector ETF with the highest total return over the past six months (Long 6-1 Winner), short the sector ETF with the lowest (6-1 Loser) and the equally weighted combination (6-1;Winner-Loser) over the available sample period. The hedge strategy is limited in value because shorting the 6-1 loser is mostly unprofitable over the sample period. In fact, the sector ETF with the worst lagged six-month return is not the worst next-month performer among sector ETFs (see the first chart in “Simple Sector ETF Momentum Strategy Robustness/Sensitivity Tests”). Including costs of shorting the loser and trading frictions for rebalancing the long and short sides would lower hedge strategy performance (but proceeds from short positions would help fund the strategy, thereby reducing capital requirements).
The average monthly net return for the hedge strategy is 0.27%, with standard deviation of monthly returns 7.79%. For comparison the average monthly net return for the 6-1 winner (loser) is 0.69% (0.41%), with standard deviation 5.55% (7.56%). Hedging elevates rather than depresses volatility.
What about hedging by shorting SPY?
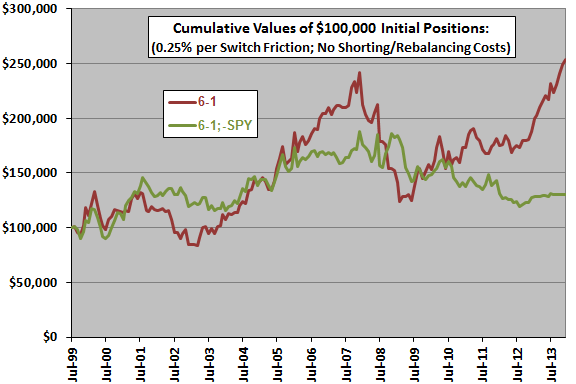
The next chart compares cumulative values of a $100,000 initial investment that each month is long the sector ETF with the highest total return over the past six months (6-1) and the combination of this basic strategy with a matched short position in SPY (6-1;-SPY) over the available sample period. Results indicate that the hedge strategy produces an inferior outcome at lower volatility. Costs of shorting and trading friction for monthly rebalancing the long and short sides would lower its performance (but proceeds from short position would help fund the strategy, thereby reducing capital requirements).
For reference, the average monthly net return of the 6-1 (6-1;-SPY) strategy over the sample period is 0.69% (0.26%), with standard deviation of monthly returns 5.55% (4.47%). Hedging does reduce volatility in this case.
For a perhaps realistic view of shorting costs, we look at a long position in SH rather than a short in SPY.
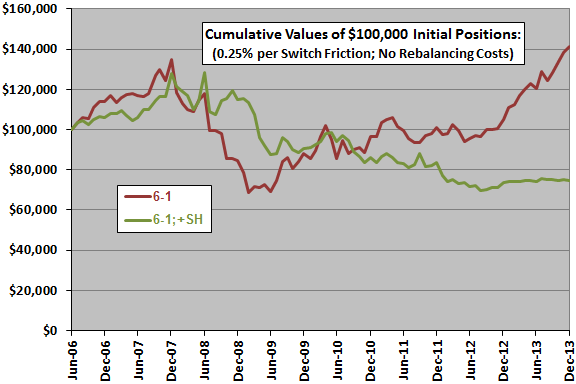
The next chart compares the cumulative value of a $100,000 initial investment in the basic 6-1 momentum strategy and the combination of this basic strategy with a matched long position in SH (6-1;+SH) over the (much shorter) available sample period. Results indicate that neither the basic momentum strategy nor the the hedge strategy produce attractive outcomes. Trading friction for monthly rebalancing combination positions would lower hedging strategy performance. The available sample period is too short for reliable inference.
For reference, the average monthly net return of the 6-1 (6-1;+SH) strategy over the sample period is 0.52% (-0.25%), with standard deviation of monthly returns 5.10% (3.93%). Hedging reduces volatility for this strategy, but generates a loss.
Finally, we consider the more complex strategy involving the S&P 500 Index 10-month SMA.
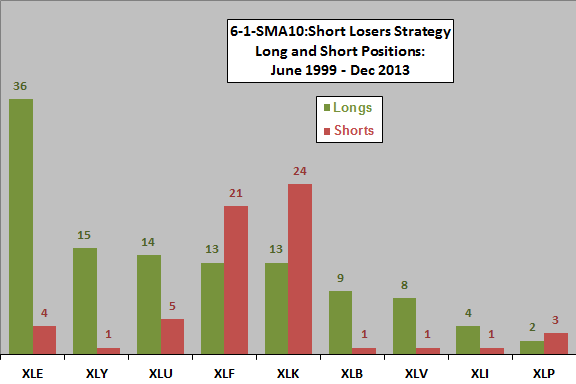
The next chart shows the distribution of 114 long positions and 61 short positions for a strategy that is long (short) the sector ETF with the highest (lowest) total return over the past six months when the S&P 500 Index is above (below) its 10-month SMA (6-1;SMA10;Short Loser). The energy sector dominates the long positions, while the technology and financial sectors dominate the short positions.
How does applying the 6-1;SMA10;Short Loser strategy translate into cumulative returns?
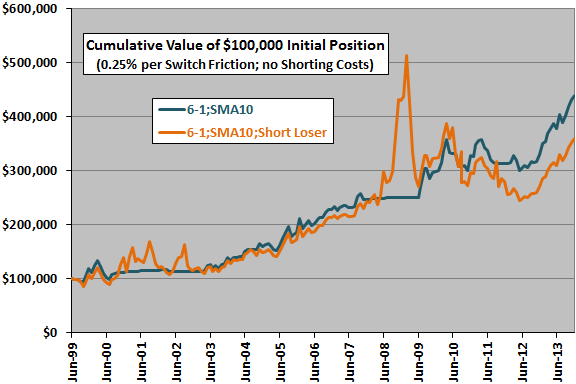
The next chart compares cumulative values of $100,000 initial investments in the 6-1;SMA10 benchmark strategy and the 6-1;SMA10;Short Loser strategy over the available sample period. The 6-1-SMA10 (6-1-SMA10:Short Loser) strategy switches 58 (74) times over the sample period. Unsurprisingly, the two strategies perform very similarly during bull markets and very differently during bear markets, but shorting momentum losers while the S&P 500 Index is below its 10-month SMA (“cash” conditions) may not yield a long-term advantage. Near the ends of bear markets, the strategy gives back gains from shorting early in bear markets, while incurring incremental trading frictions.
Including costs for shorting would lower the performance of the 6-1-SMA10:Short Loser strategy during “cash” conditions.
How do the monthly return statistics for the two strategies compare during “cash” conditions?
The following table summarizes the average monthly net returns and the standard deviations of monthly net returns for the 6-1-SMA10 and 6-1-SMA10:Short Loser strategies during the 61 months the former is in cash. The 6-1-SMA10:Short Loser strategy has a higher average return but also a much higher volatility during these months. As shown above, the volatility works against the higher average in generating cumulative return. Including costs for shorting would lower the average monthly return of the 6-1-SMA10:Short Loser strategy.

In summary, evidence from simple tests over available sample periods suggests that combining basic sector ETF momentum strategies with hedges/shorting generally does not improve outcome.
Cautions regarding findings include:
- Sample periods (especially for SH) are short in terms of number of independent six-month ranking intervals and 10-month SMA calculation intervals.
- Iterating tests on a given sample introduces data snooping bias (discovery of lucky indicators/parameter settings), thereby overstating results for the best performers. There may also be “second hand” data snooping bias derived from selecting indicators/parameter settings based on findings of prior research using the same or similar data. Data snooping bias is especially pernicious for small samples.
- Potential wildness in ETF monthly return distributions limits confidence in results.