The Simple Asset Class ETF Momentum Strategy (SACEMS) each month picks winners based on total return over a specified ranking (lookback) interval from the following eight asset class exchange-traded funds (ETF), plus cash:
- PowerShares DB Commodity Index Tracking (DBC)
- iShares MSCI Emerging Markets Index (EEM)
- iShares MSCI EAFE Index (EFA)
- SPDR Gold Shares (GLD)
- iShares Russell 2000 Index (IWM)
- SPDR S&P 500 (SPY)
- iShares Barclays 20+ Year Treasury Bond (TLT)
- Vanguard REIT ETF (VNQ)
- 3-month Treasury bills (Cash)
Based on findings in “SACEMS Portfolio-Asset Addition Testing”, a subscriber proposed adding iShares JPMorgan Emerging Market Bond Fund (EMB) to this set. To investigate, we revisit relevant analyses and conduct robustness tests, with focus on the equal-weighted (EW) Top 3 SACEMS portfolio. Using monthly dividend-adjusted closing prices for asset class proxies and the yield for Cash during February 2006 (when all ETFs in the baseline universe are first available) through June 2019, we find that:
First, we note that since EMB inception, average monthly return for EMB (EEM) is 0.55% (0.29%) with standard deviation 3.33% (6.55%). Correlation of EMB and EEM monthly returns is 0.66. In other words, even though EMB holds government bonds and EEM holds equities, the two ETFs are similar. Including both in the SACEMS universe could at times put a heavy bet on emerging markets.
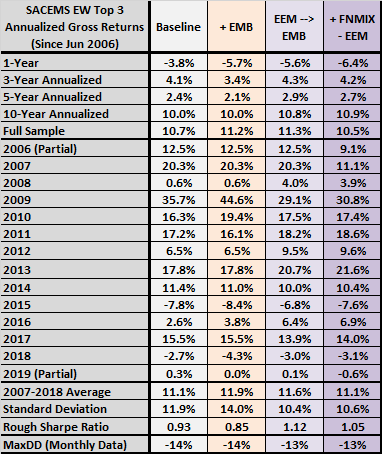
Next, we summarize in the following table annualized/annual performance statistics for SACEMS EW Top 3 for the original universe (Baseline) and three alternatives using the baseline 4-month lookback interval:
- + EMB: add EMB to the original universe.
- EEM –> EMB: replace EEM with EMB at inception of the latter (December 2007) to alleviate concern about a heavy bet on emerging markets.
- + FNMIX – EEM: replace EEM with Fidelity New Markets Income Fund (FNMIX) over the full sample period. Since EMB inception, FNMIX has average monthly return 0.59% with standard deviation 2.94% and correlation 0.87 with EMB monthly returns. This alternative simulates extension of the EMB sample back to February 2006.
Notable points are:
- EEM –> EMB has the highest gross compound annual growth rate (CAGR) and the highest gross rough Sharpe ratio (average annual return divided by standard deviation of annual returns), with the lowest annual volatility.
- + EMB has the highest average annual return but the lowest gross rough Sharpe ratio.
- +FNMIX – EEM does not confirm improvement in gross CAGR but does confirm improvement in gross rough Sharpe ratio.
- Differences in maximum drawdown (MaxDD) are small.
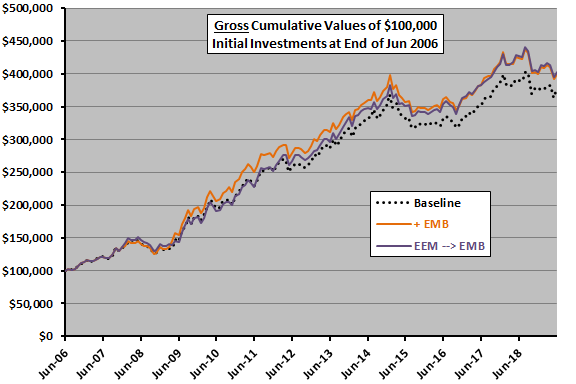
For perspective, we look at cumulative EW Top 3 performances.
The following chart tracks gross values of $100,000 initial investments in each of Baseline, + EMB and EEM –> EMB at the end of June 2006. This perspective confirms the benefit of adding EMB to the universe.
Overall, replacing EEM with EMB at inception of the latter seems the most prudent alternative.
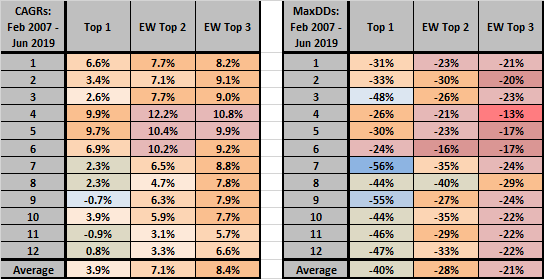
As a robustness test, we look at effects of EEM –> EMB across SACEMS Top 1, EW Top 2 and EW Top 3 portfolios and across lookback intervals ranging from one to 12 months.
The following two tables map CAGRs (left table) and MaxDDs (right table) across SACEMS portfolios and lookback intervals with EEM –> EMB. All calculations start at the end of February 2007 to include all original universe ETFs for the longest lookback interval.
Notable points are:
- As for Baseline (and more emphatically), a 4-month lookback interval is optimal for EEM –> EMB.
- Results are not attractive for longer lookback intervals.
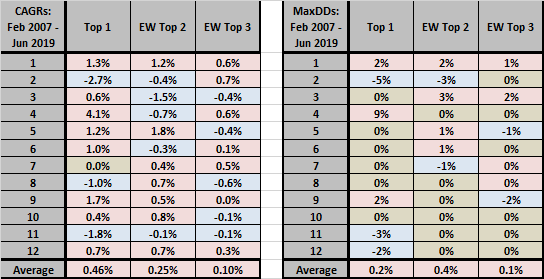
For greater insight, we compare these results to those for the same robustness test performed on the original universe.
The next two tables summarize differences in CAGRs (left table) and MaxDDs (right table) across SACEMS portfolios and lookback intervals between EEM –> EMB and Baseline. Red (blue) shading indicates where EEM –> EMB performs better (worse) than Baseline. On average, EEM –> EMB improves CAGRs and MaxDDs for all three SACEMS portfolios. CAGR improvement is most dramatic for the Top 1 portfolio with a 4-month lookback interval.
As another robustness test, we look at the effect of EEM –> EMB on “Combined Value-Momentum Strategy (SACEVS-SACEMS)”.
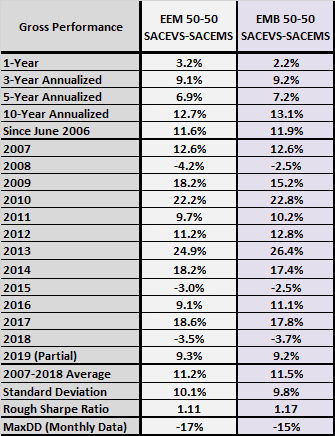
The next table summarizes annualized/annual performance statistics for equal-weighted, monthly rebalanced combinations of the Simple Asset Class ETF Value Strategy (SACEVS) Best Value portfolio and SACEMS EW Top 3 for:
- EEM 50-50 SACEVS-SACEMS: using the original SACEMS universe.
- EMB 50-50 SACEVS-SACEMS: using the EEM –> EMB SACEMS universe.
EMB 50-50 SACEVS-SACEMS wins based on all full-sample gross metrics.
Finally, we perform a longer backtest using mutual funds by first updating “SACEMS Applied to Mutual Funds” and then substituting FNMIX for Vanguard Emerging Markets Stock Index Investor Shares (VEIEX).
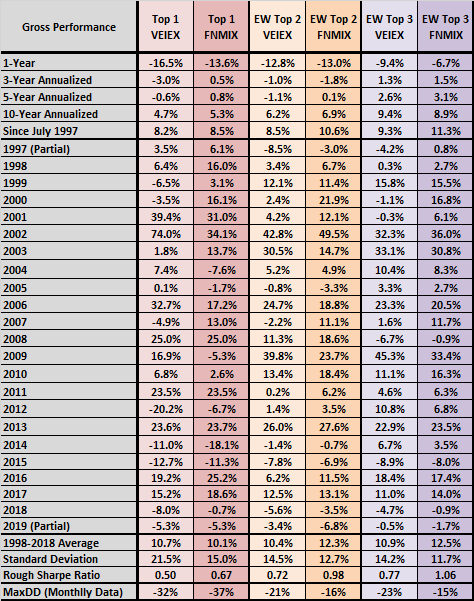
The final table summarizes annualized/annual performance statistics for SACEMS Top 1, EW Top 2 and EW Top 3 portfolios as applied to two universes since July 1997 with a 4-month lookback interval:
- VEIEX: the original universe including an EEM proxy.
- FNMIX: a revised universe substituting an EMB proxy for the EEM proxy.
Notable points are:
- FNMIX wins across all three SACEMS portfolios for gross CAGR and gross rough Sharpe ratio. It wins EW Top 2 and EW Top 3 for MaxDD.
- CAGR and rough Sharpe ratio for EW Top 3 FNMIX are similar to those for EEM –> EMB in the first table above.
Overall, it appears that EMB captures emerging markets rewards more effectively than EEM within SACEMS.
In summary, evidence in favor of substituting EMB for EEM when EMB becomes available is strong enough to justify making the change.
Implementation considerations are:
- This change has no effect on allocations for July 2019.
- By the end of the month, we will replace performance data in “Momentum Strategy” and “Combined Value-Momentum Strategy” with those based on EEM –> EMB with a 4-month lookback interval.
- We will over time update supporting research in “Momentum Strategy” to reflect the change in universe.
Cautions regarding findings include:
- As noted, findings are generally gross, not net. However, differences in number of switches among alternatives are small.
- Analyses are in-sample, using all available data to get the best forward-looking choice. Available ETF samples are not long enough for useful out-of-sample testing. The longer mutual fund test offers mitigation for this concern.
- Testing many universe alternatives as in “SACEMS Portfolio-Asset Addition Testing” and here introduces data snooping bias, such that the best-performing universes overstate expectations. While the best expectation is still the best, snooping undermines conviction.
- It is not obvious, but perhaps plausible, that emerging markets government bonds would be related due to narrow industrial bases, close government-corporate connections and currency exchange considerations.