Readers have suggested three alternative metrics for the strategy tested in the “Simple Sector ETF Momentum Strategy Performance”: (1) Sharpe Ratio over the past six months; (2) slope of price over the past six months; and, (3) average of three-month, six-month and 12-month past returns. Do these metrics outperform past six-month return in a momentum strategy applied to the following nine sector exchange-traded funds (ETF) defined by the Select Sector Standard & Poor’s Depository Receipts (SPDR), all of which have trading data back to December 1998:
Materials Select Sector SPDR (XLB)
Energy Select Sector SPDR (XLE)
Financial Select Sector SPDR (XLF)
Industrial Select Sector SPDR (XLI)
Technology Select Sector SPDR (XLK)
Consumer Staples Select Sector SPDR (XLP)
Utilities Select Sector SPDR (XLU)
Health Care Select Sector SPDR (XLV)
Consumer Discretionary Select SPDR (XLY)
The three alternative strategies are, at the end of each month, allocate all funds to the sector ETF with the highest: (1) monthly Sharpe Ratio over the past six months (SR6-1); (2) monthly price slope over the past six months (Slope6-1); and, (3) average of past three-month, six-month and 12-month past total returns (3-1;6-1;12-1). For comparison, we include the strategy of monthly allocation to the sector ETF with the highest total return over the past six months (6-1). Using monthly dividend-adjusted closing prices for the nine sector ETFs over the period December 1998 through December 2014 (193 months), we find that:
We assume the risk-free rate is negligible (or unimportant) so that the SR6-1 signals derive from the mean monthly total return divided by the standard deviation of monthly total returns over the past six months. We examine the 3-1;6-1;12-1 alternative separately from the other two because of its shorter available test period.
The following chart compares the frequencies of sector ETF winners for the 6-1, SR6-1 and Slope6-1 strategies over the available sample period. The 6-1 strategy generates 79 switches, compared to 76 for SR6-1 and 58 for Slope6-1. The SR6-1 strategy tends to spread winners more evenly across ETFs.
How do cumulative returns of the three strategies compare?

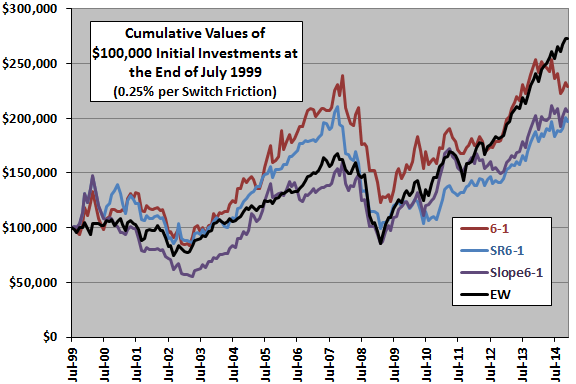
The next chart compares the cumulative values of $100,000 initial investments in the 6-1, SR6-1 and Slope6-1 strategies and in an equally weighted portfolio of the sector ETFs (EW), rebalanced monthly, over the available sample period. Calculations derive from the following assumptions:
- Reallocate at the close on the last trading day of each month (assume that we can calculate momentum metrics for the ETFs just before the close).
- Trading (switching) friction is 0.25% of the balance whenever there is a change in holdings, but EW portfolio rebalancing is frictionless for conservative benchmarking.
At the assumed level of switching friction, the original 6-1 strategy beats the SR6-1 and Slope6-1 strategies most of the time. Slope6-1 often underperforms EW. Compound annual growth rates are 5.5%, 4.5% and 4.8% for 6-1, SR6-1 and Slope6-1, respectively
The 6-1 strategy wins by a slightly wider margin with trading friction set to zero.
How do average monthly returns, as alternative measures of strategy performance, compare?
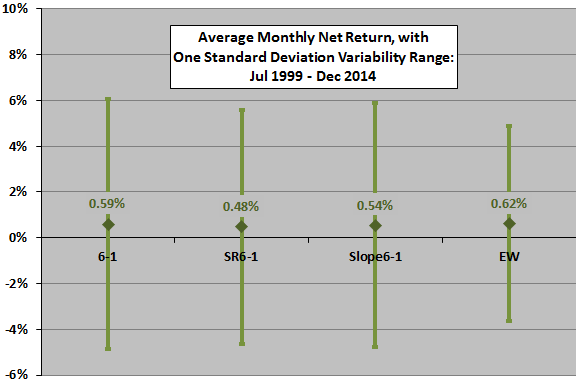
The next chart depicts the average monthly net total returns (with 0.25% switching frictions) and the standard deviations of monthly returns for the 6-1, SR6-1 and Slope6-1 strategies and EW over the available sample period. The three momentum strategies exhibit similar volatilities, with the 6-1 strategy having higher average monthly return than the alternative metrics.
Setting trading friction to zero improves average monthly returns by 0.08%-0.10% for the three alternatives.
What about the 3-1;6-1;12-1 strategy?
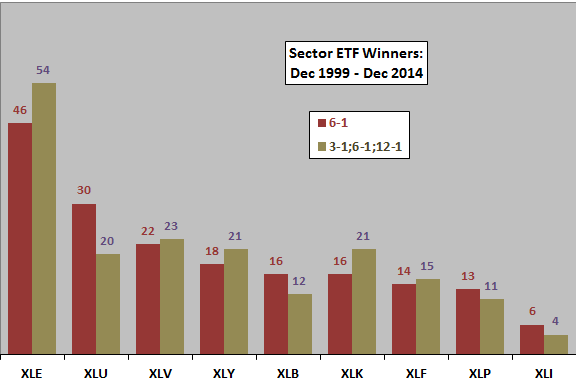
The next chart compares the frequencies of sector ETF winners for the 6-1 and 3-1:6-1:12-1 strategies over the available sample period. Because of its construction, the test period for the 3-1;6-1;12-1 strategy begins in January 2000 rather than July 1999 (to allow calculation of 12-month lagged returns). The 3-1:6-1:12-1 strategy generates slightly fewer switches (71 versus 75).
How do cumulative returns of the two strategies compare?
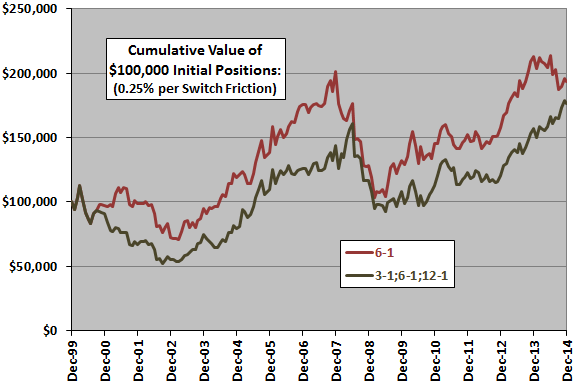
The final chart compares the cumulative values of $100,000 initial investments in the 6-1 and 3-1:6-1:12-1 strategies over the available sample period. Calculations derive from the same assumptions used above (with 0.25% switching frictions).
The 3-1:6-1:12-1 strategy trails the 6-1 strategy over most of the sample period. Note that the second chart in “Simple Sector ETF Momentum Strategy Robustness/Sensitivity Tests” suggests 3-month (12-month) lagged returns perform poorly (indifferently) as standalone selectors of momentum winners over the sample period. Compound annual growth rates are 4.5% and 3.9% for 6-1 and 3-1;6-1;12-1, respectively
Setting trading friction to zero slightly degrades the performance of the 3-1;6-1;12-1 strategy relative to the 6-1 strategy.
The average monthly net total return for the 6-1 (3-1:6-1:12-1) strategy with 0.25% switching friction is 0.51% (0.46%) over the entire sample period, with standard deviation of monthly returns 5.38% (5.41%).
In summary, evidence from simple tests does not support a belief that any of the three alternative momentum metrics are better than past six-month return for a sector ETF momentum strategy.
Cautions regarding findings include:
- Sample size is modest (just 32 independent six-month momentum ranking intervals and 16 independent 12-month ranking intervals).
- Iterating tests on a given sample introduces data snooping bias (discovery of lucky indicators/parameter settings), thereby overstating results for the best performer. There may also be “second hand” data snooping bias derived from selecting indicators/parameter settings based on findings of prior research using the same or similar data. Data snooping bias is especially pernicious for small samples.