Does average sign of recent returns work as well as recent cumulative return as a momentum metric? In their May 2017 paper entitled “Returns Signal Momentum”, Fotis Papailias, Jiadong Liu and Dimitrios Thomakos introduce and test a momentum strategy (RSM) based on the equally weighted average signs (1 for positive and 0 for negative) of past returns over a given lookback interval. This metric employs each of the past returns during the lookback interval, not a single cumulative return as in times series (intrinsic or absolute) momentum. It considers only signs of past returns, not their magnitudes as in conventional relative momentum. They focus on monthly returns over a lookback interval of 12 months. They test RSM on a universe of 55 of the most liquid futures/forwards: 24 commodities; 9 currency exchange rates versus the U.S. dollar; 9 developed country equity indexes; and, 13 government bonds of various maturities from six developed countries. Their strategy is each month long (short) a contract series when average sign of its last 12 monthly returns is above (below) a threshold. They consider two types of thresholds: (1) fixed over the test period, with the featured optimal value selected by experimentation; and, (2) time-varying, each month choosing the best-performing value (from among 0.2, 0.3, 0.4, 0.5, 0.6, 0.7 and 0.8) over the prior 24 months. Using returns for the 55 futures/forwards series as available to support a strategy test period of January 1985 through March 2015, they find that:
- Linear regressions indicate that, for equity index futures, average sign of past returns has significantly positive relationships with returns for each of the next four months and significantly negative relationships with returns for future months 12 to 24. For other futures asset classes, durations of positive relationships are shorter.
- For the RSM strategy with fixed average sign threshold, on a gross basis:
- For thresholds no larger than 0.5, RSM outperforms equal-weighted long, 12-month simple moving average and time series momentum benchmark strategies. Average annual returns are at least 10%, with lower volatilities and shallower maximum drawdowns than time series momentum.
- The optimal threshold is about 0.4, with annualized Sharpe ratio 21% higher (0.96 versus 0.79), cumulative return 68% higher and maximum drawdown 33% shallower (-20% versus -29%) than time series momentum.
- For the RSM strategy with time-varying average sign threshold, on a gross basis (see the chart below):
- The threshold generally increases (decreases) with market volatility, tending to exploit uptrends and avoid crises.
- RSM again provides higher average return, higher Sharpe ratio and shallower maximum drawdown than benchmark strategies.
- RSM has modestly lower average annual return (11.0% versus 11.9%), lower Sharpe ratio (0.92 versus 0.96) and deeper maximum drawdown (-27% versus -20%) than RSM with optimal 0.4 fixed threshold.
- Accounting for one-way portfolio reformation frictions of 0.4%:
- For RSM with optimal fixed threshold, reduces average annual return from 11.9% to 9.8% and annualized Sharpe ratio from 0.96 to 0.79.
- For RSM with time-varying threshold, reduces average annual return from 11.0% to 8.8% and annualized Sharpe ratio from 0.92 to 0.74.
- For time series momentum as the best-performing benchmark, reduces average annual return from 10.3% to 8.1% and annualized Sharpe ratio from 0.79 to 0.63.
- The global equity market explains about 40% of the variation in RSM strategy returns. RSM returns also have significant positive relationships with both conventional momentum and time series momentum factors.
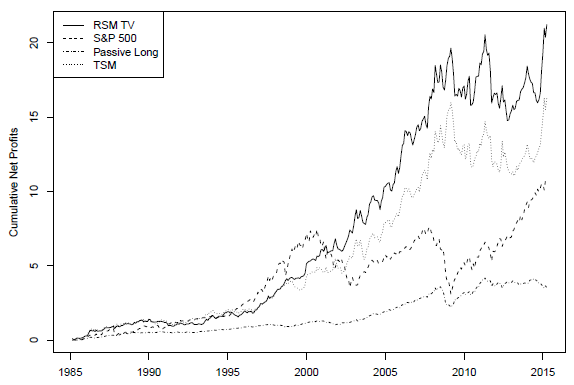
The following chart, taken from the paper, compares gross cumulative profits of four strategies:
- RSM with time-varying threshold (RSM TV) as described above.
- The S&P 500 Index.
- A strategy that is long all futures/forwards with equal weights (Passive Long).
- A time series momentum (TSM) with lookback interval and portfolio rules similar to those of RSM TV.
RSM TV has the highest terminal value. Gross outperformance of RSM TV concentrates during the second half of the sample period. Accounting for monthly portfolio reformation costs would reduce returns of the three futures/forwards strategies.
In summary, evidence indicates that average sign of returns over medium-term lookback intervals may be exploitable as a predictor of future near-term returns across asset classes.
Cautions regarding findings include:
- The RSM strategy with optimal fixed threshold incorporates bias from snooping alternative values, thereby overstating expectations.
- The RSM strategy with time-varying threshold may incorporate snooping bias from selection of a 24-month interval for threshold calculation.
- Collective momentum metric model snooping in the body of related research may also inflate expectations.
- Data collection/processing requirements for RSM (especially RSM TV) are beyond the reach of most investors, who would bear fees for delegating this work to a fund manager.
See the related “Intrinsic Momentum Investing”.