Has the stock market adapted to widespread investor efforts to exploit intermediate-term return momentum? In their paper entitled “Momentum Loses Its Momentum: The Implication on Market Efficiency”, Debarati Bhattacharya, Raman Kumar and Gokhan Sonaer evaluate the robustness of momentum returns in the U.S. stock market over time via consideration of three subperiods: 1965-1989 (SP1), 1990-1998 (SP2), and 1999-2010 (SP3). They focus on SP3 to measure post-discovery persistence of the momentum effect. They form overlapping portfolios monthly by ranking stocks into deciles (tenths) based on six-month cumulative past returns and holding for six months or 12 months (and 24 months for one test). Using monthly returns and firm characteristics for a broad sample of U.S. stocks over the period 1965 through 2010, they find that:
- A hedge portfolio that is long (short) the tenth of stocks with the highest (lowest) past six-month returns, reformed monthly, generates average monthly gross returns of 1.10% (1.37%) over a six-month holding interval during SP1 (SP2). However, during SP3, average monthly gross return declines to a statistically insignificant 0.72%. Results for a 12-month holding interval are somewhat lower for all three subperiods.
- The monthly three-factor (market, size, book-to-market) gross alpha for this strategy is 1.27% (1.35%) over a six-month holding interval during SP1 (SP2). However, during SP3, average monthly gross alpha declines to a statistically insignificant 0.57% (see the chart below). Results for a 12-month holding interval are somewhat lower for all three subperiods.
- During SP3, augmenting the Fama-French three-factor (market, size and book-to-market) model with a momentum factor fails to improve prediction of future stock returns.
- Results are robust to exclusion of “unusual” years during SP3 (and, in fact, SP2 arguably includes unusual years).
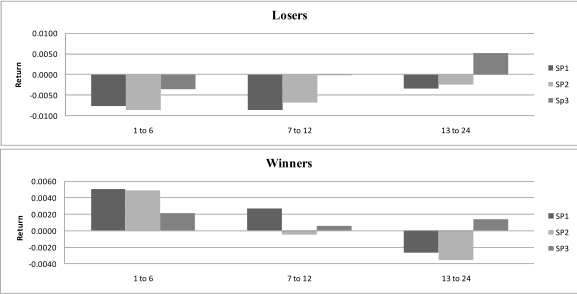
The following chart, taken from the paper, compares by study subperiod average gross three-factor alphas of stocks within the lowest (Losers) tenth and the highest (Winners) tenth of past six-month returns for extended holding intervals out to two years after portfolio formation. The chart shows that:
- Losers and Winners momentum during months 1-6 after portfolio formation is much lower for SP3 than for the two earlier subperiods.
- Losers and Winners exhibit no momentum during months 7-12 after portfolio formation for SP3.
- Average returns for both Losers and Winners during months 13-24 are quite different for SP3 compared to the first two subperiods.
Results suggest that dissipation of intermediate-term investor overreaction may explain the disappearance of momentum.

In summary, evidence indicates that the gross profitability of intermediate-term return momentum for U.S. stocks dissipates considerably since the late 1990s, and that momentum may no longer qualify as a fourth return adjustment factor.
Note that:
- Return and alpha calculations in the study are gross. Net values accounting for trading frictions would be materially lower.
- Data snooping bias related to subperiod selection may play a role in the flow and ebb of the momentum effect (as an adjunct or alternative to market adaptation).
- The statistical significance test used in the study assumes tame stock return distributions. To the extent that actual return distributions are wild, this test breaks down.
Also, a subscriber noted that the average monthly gross momentum alpha for the six-month holding period during SP3, which translates to an annualized alpha around 7%, still seems economically significant. Note that:
- The t-stat in the paper for SP3 momentum alpha is not high, indicating considerable variability in the data contributing to the average. In other words, a statistician would say that confidence in the SP3 momentum alpha being reliably different from zero is not high.
- The alpha is gross, and momentum portfolios reformed monthly tend to generate quite a bit of turnover and thereby burdensome trading frictions. It would be interesting to see whether relatively illiquid stocks contribute the lion’s share of the gross alpha, making trading frictions even more of a concern. In any case, a manager would not be able to extract 7% alpha before trading frictions, and the manager’s administrative fees would further eat into any residual. See, for example, “Trading Friction as a Momentum Killer”.
- It would also be interesting to see whether the gross alpha is front loaded in SP3, indicating gradual (rather than stepwise) extinction. See the trend line in “The Decision Moose Asset Allocation Framework”.
See “Loss of Momentum?” for a similar study but some different angles.