
Is simple momentum the secret sauce of Managed Futures funds? In their 2013 paper entitled “Demystifying Managed Futures”, Brian Hurst, Yao Ooi and Lasse Pedersen examine how well simple trend-following strategies based on time series (intrinsic or absolute) momentum explain the performance of Managed Futures funds. Their simple intrinsic momentum strategy goes long (short) a contract series with a positive (negative) return relative to the risk-free rate over 1-month, 3-month and 12-month look-back intervals. They apply the strategy to a liquid universe of 24 commodity futures, 9 equity futures, 13 government bond futures and 12 currency forwards. They adopt a simple diversification weighting that targets 40% annualized volatility for each position. They rebalance the diversified portfolio weekly at the Friday close based on data from the Thursday close. They ignore rebalancing/roll frictions. Using daily and weekly prices for 58 futures contract and currency forward series during January 1985 through June 2012, they find that:
- There is strong evidence that futures/forwards follow trends across asset classes and for different look-back intervals.
- The intrinsic momentum strategy generates positive gross returns in almost every case, with average annualized gross Sharpe ratios across assets of 0.29 for the 1-month interval, 0.36 for the 3-month interval and 0.38 for the 12-month interval. Average pair-wise correlation of single-asset momentum returns is less than 0.1 for each look-back interval.
- Longer momentum measurement intervals outperform shorter ones, but even the 1-month interval diversified across all assets has a gross annualized Sharpe ratio of 1.3.
- Annualized gross Sharpe ratios of portfolios diversified by asset class across look-back intervals range from 0.78 for equities to 1.05 for commodities.
- For a portfolio diversified across all assets and look-back intervals, the annualized gross Sharpe ratio is 1.8.
- The diversified intrinsic momentum portfolio is itself a good diversifier of traditional asset classes, with return correlations of: -0.02 with the S&P 500 Index; 0.23 with the Barclays U.S. Aggregate Bond Index; and, 0.05 with the S&P GSCI.
- The intrinsic momentum strategy works especially well during prolonged equity bull and bear markets.
- Gross performances of daily and weekly rebalancings are similar, trailing off for monthly and quarterly rebalancings.
- Regarding execution of the intrinsic momentum strategy:
- Annual transaction costs of a Managed Futures fund are about 1-4% for a sophisticated trader, but possibly much higher for less sophisticated traders. Transaction costs decline over time. Transaction costs generally increase with rebalancing frequency.
- Margin requirements are 8-12% for a large institutional investor, but more than double that for a small investor.
- A regression of Managed Futures index and manager returns on diversified intrinsic momentum strategy returns generates R-squared statistics of 0.36 to 0.64, suggesting that trend-following is an important component of fund strategies. In fact, controlling for diversified intrinsic momentum returns drives the alphas of most indexes and managers below zero.
The following chart, taken from the paper, tracks cumulative gross values of $100 initial investments at the end of 1985 in: (1) the intrinsic momentum strategy diversified across all assets as described above; and, (2) the S&P 500 Index. The diversified intrinsic momentum strategy performs very consistently over the sample period.
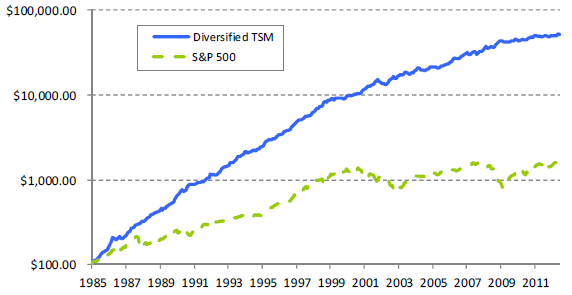
In summary, evidence indicates that an intrinsic momentum strategy diversified across liquid futures/forwards contracts performs consistently well on a gross basis and may be a good substitute for a Managed Futures fund.
Cautions regarding findings include:
- As noted in the paper, findings are gross, not net. Incorporating reasonable trading frictions would lower performance (more for small investors than large).
- Implementation of the diversified futures portfolio may be infeasible for many investors.
Frequently Asked Questions
What is intrinsic (time series) momentum in futures trading?
Intrinsic momentum, also called time series or absolute momentum, is a trend-following approach that goes long a futures or forward contract with a positive return relative to the risk-free rate over a look-back period and short one with a negative return. The study applied it over 1-month, 3-month and 12-month look-back intervals. It judges each contract against its own past return rather than against other assets.
Does a diversified intrinsic momentum strategy work across futures markets?
A diversified intrinsic momentum strategy produced a gross annualized Sharpe ratio of 1.8 across 58 futures and forwards from January 1985 through June 2012. Average single-asset gross Sharpe ratios were 0.29 (1-month), 0.36 (3-month) and 0.38 (12-month), with positive gross returns in almost every case. These results are gross of trading costs, so they overstate what investors would actually earn.
How is an intrinsic momentum strategy built and rebalanced across futures and forwards?
The intrinsic momentum strategy goes long or short each of 58 liquid contracts (24 commodity futures, 9 equity futures, 13 government bond futures and 12 currency forwards) based on the sign of its return versus the risk-free rate over 1-, 3- and 12-month look-backs. Each position targets 40% annualized volatility, and the portfolio is rebalanced weekly at Friday's close using Thursday's close data. Rebalancing and roll frictions were ignored.
Can trend-following explain Managed Futures fund returns, and how does it compare with traditional assets?
Diversified intrinsic momentum returns explain a substantial share of Managed Futures fund returns, with regression R-squared values of 0.36 to 0.64 for indexes and managers. Controlling for them pushes the alphas of most indexes and managers below zero. The strategy is also a diversifier of traditional assets, with return correlations of -0.02 to the S&P 500, 0.23 to the Barclays U.S. Aggregate Bond Index and 0.05 to the S&P GSCI.
What are the limitations and risks of using an intrinsic momentum futures strategy?
The intrinsic momentum strategy's reported results are gross, not net, so reasonable trading frictions would lower performance, more so for small investors than large ones. Annual transaction costs run about 1-4% for sophisticated traders but possibly much higher for others, and margin requirements of 8-12% for large institutions can more than double for small investors. Implementing a diversified futures portfolio may be infeasible for many investors.