Does a cross-asset class, momentum-driven, simplified version of Modern Portfolio Theory (MPT) offer reliably strong performance over the long run? In their December 2014 paper entitled “A Century of Generalized Momentum; From Flexible Asset Allocations (FAA) to Elastic Asset Allocation (EAA)”, Wouter Keller and Adam Butler present an asset allocation strategy based on five concepts:
- MPT is a sound framework for portfolio construction.
- Momentum, a form of trend measurement, is a generally effective way to estimate key inputs to MPT: asset returns (R), return volatilities (V) and return correlations (C).
- Crash protection based on excluding assets with negative past returns is a reasonable corollary of reliance on trends.
- Tractability requires compromise to strict MPT, such as calculating return correlations relative to a single index (the equally weighted average returns of all assets).
- Recognition of differences in import among inputs means weighting R, V and C inputs differently according to their elasticities (how much small changes in R, V and C affect the optimal portfolio weight for the asset).
The fifth concept is the innovation relative to the Flexible Asset Allocation (FAA) predecessor (see “Asset Allocation Combining Momentum, Volatility, Correlation and Crash Protection”), which weights expected R, V and C inputs based on a simple scoring system. The new Elastic Asset Allocation (EAA) strategy each month scores all assets in a universe by: (1) calculating expected R, V and C for each asset as geometrically weighted averages of past values; and, (2) weighting the expected values of R, V and C by their respective elasticities. For R, they use average total monthly excess (relative to the 13-week U.S. Treasury bill yield) returns over the last 1, 3, 6 and 12 months. For V and C, they use the last 12 monthly returns. To test the EAA strategy, they each month reform a long-only portfolio of the top-ranked assets weighted by their respective scores. They replace a fraction of the portfolio with 10-year U.S. Treasury notes (selected empirically as the best “cash” asset) according to the fraction of assets in the universe with non-positive excess returns. They apply a nominal one-way index switching friction of 0.1%. They consider three universes of 7, 15 and 38 asset classes. They emphasize Calmar ratio (focusing on drawdown) as a key optimization metric, but also consider Sharpe ratio. To mitigate data snooping, they optimize elasticity parameters during April 1914 through March 1964 and test it out-of-sample during April 1964 through August 2014. Using monthly returns for the three sets of financial asset indexes as available during April 1914 through August 2014, they find that:
- Elasticity optimization exercises across different universes of assets suggest two sets of “golden” elasticity parameters that are near-optimal across all universes considered:
- The Golden Offensive EAA set of elasticity parameters generates high returns.
- The Golden Defensive EAA set of elasticity parameters suppresses drawdown.
- Based on out-of-sample tests on the three asset universes, the Golden EAA strategies easily outperform both an equally weighted, monthly rebalanced portfolio of all assets (EW) and the S&P 500 Index. For example,:
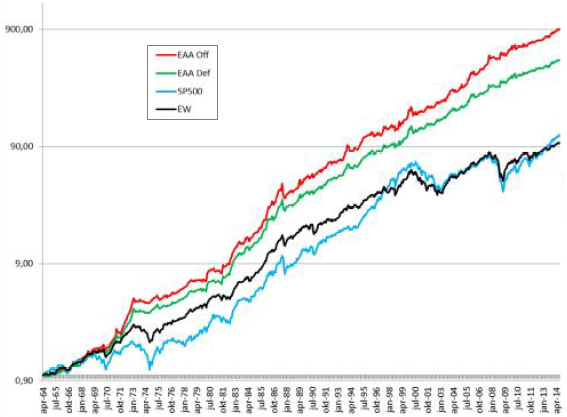
- For the 7-asset universe, annualized Sharpe ratios for the Golden Offensive EAA and the Golden Defensive EAA are 0.83 and 0.83, compare to 0.40 for EW and 0.32 for the S&P 500 Index (see the chart below).
- For the 15-asset universe, annualized Sharpe ratios for the Golden Offensive EAA and the Golden Defensive EAA are 0.60 and 0.66, compare to 0.43 for EW.
- For the 38-asset universe, annualized Sharpe ratios for the Golden Offensive EAA and the Golden Defensive EAA are 0.97 and 0.91, compare to 0.48 for EW.
The following chart, taken from the paper, compares out-of-sample performances of tests of four portfolios during April 1964 through August 2014:
- The Golden Offensive EAA (EAA Off)
- The Golden Defensive EAA (EAA Def)
- Buying and holding the S&P 500 Index (SP500)
- An equally weighted, monthly rebalanced portfolio of all assets in the universe (EW)
The Golden EAA portfolios outperform SP500 and EW principally by avoiding major drawdowns.
In summary, evidence indicates that a tractable version of MPT, fueled by expectations from intermediate term momentum across return, volatility and correlation inputs, may support an outperforming investment strategy.
Cautions regarding findings include:
- As indicated by the length of the introductory paragraph above, the EAA strategy is complex and likely beyond the reach of many investors on their own. Delegating strategy execution to an advisor or fund would incur fees.
- Motivations for several aspects of EAA may derive from prior experience with recent data, thereby diminishing the purity of the out-of-sample tests in the paper.
- It is not clear which aspects of EAA drive the most outperformance. It may be that simpler models can capture most of it.
- The crash protection approach, which allocates to 10-year U.S. Treasury notes, may not work well in a rising interest rate environment.
- As noted in the paper, using old index data carries several cautions:
- Data may not have been available in a timely manner as assumed, making a part of backtests unrealistic. A robustness test with one-month delay may be informative.
- The costs of setting up and maintaining tracking funds for the specified asset classes, and the costs of monthly switching among funds, may have been very high for a large part of the sample period, reducing strategy performance. Moreover, if tracking funds had existed, market feedback from trading them may have affected market behaviors.
- In general, if the data/processing power needed to execute EAA had been easily available over the entire sample period, market behaviors may have been different.
See “Asset Allocation Combining Momentum, Volatility, Correlation and Crash Protection” and “Momentum-boosted Practical Approach to MPT” for the flow of the research stream.